EX-99.2
Published on August 5, 2025
|
SECOND QUARTER 2025 |

|
2 FORWARD-LOOKING STATEMENTS Please note that in this presentation we may use words such as “appears,” “anticipates,” “believes,” “plans,” “expects,” “intends,” “future,” and similar expressions which constitute forward-looking statements within the meaning of the safe harbor provisions of the Private Securities Litigation Reform Act of 1995. Forward-looking statements are made based on our expectations and beliefs concerning future events impacting the Company and therefore involve a number of risks and uncertainties. We caution that forward-looking statements are not guarantees and that actual results could differ materially from those expressed or implied in the forward-looking statements. Potential risks and uncertainties that could cause the actual results of operations or financial condition of the Company to differ materially from those expressed or implied by forward-looking statements in this presentation, include, but are not limited to those risks and uncertainties more fully described from time to time in the Company's public reports filed with the Securities and Exchange Commission, including under the section titled “Risk Factors” in the Company's Annual Report on Form 10-K, and/or Quarterly Reports on Form 10-Q, as well as in the Company’s Current Reports on Form 8-K. All forward-looking statements included in this presentation are based upon information available to the Company as of the date of this presentation and speak only as of the date hereof. We assume no obligation to update any forward- looking statements to reflect events or circumstances after the date of this presentation. 2 |
|
TODAY’S PRESENTERS 3 BRAD WILLIAMS President BLAINE BROWERS Chief Financial Officer WARREN KANDERS Chief Executive Officer and Chairman of the Board |

|
4 AGENDA • Q2 Highlights • Business Overview • Financial Summary • Full Year Outlook • Conclusion and Q&A |
|
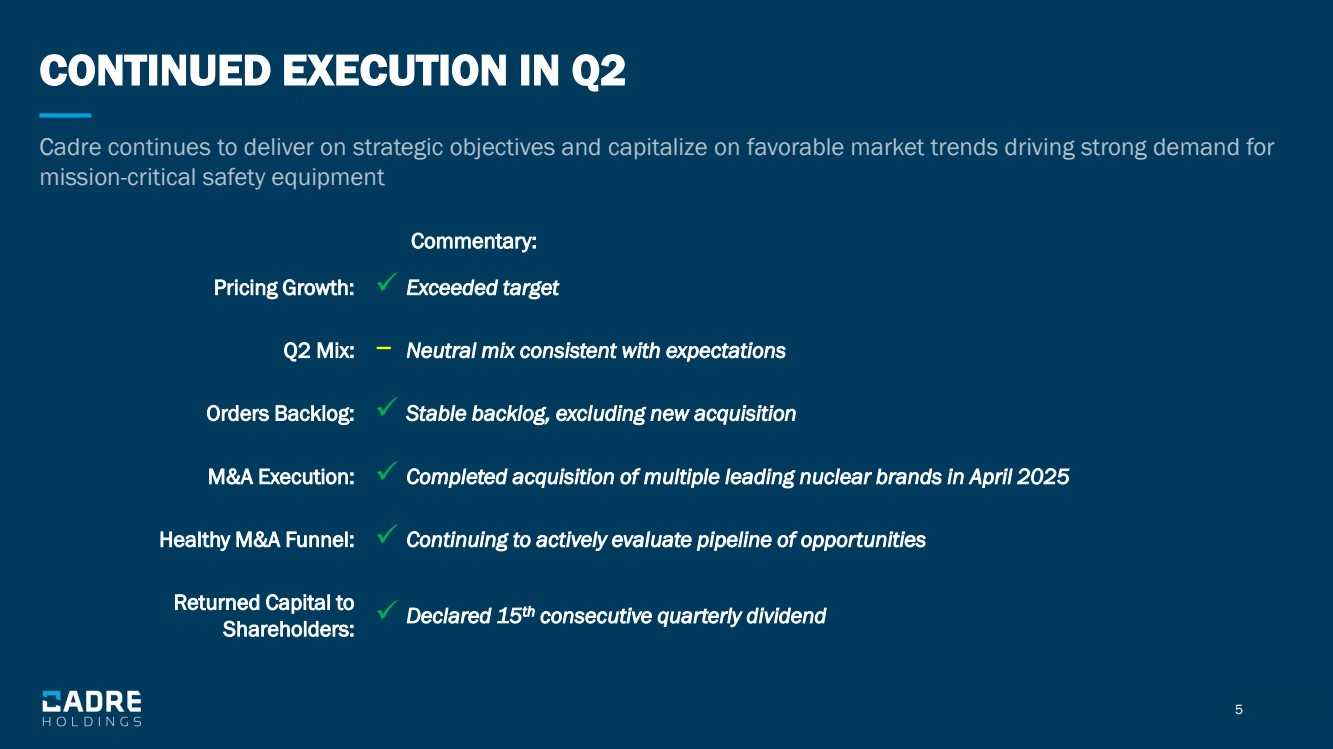
5 CONTINUED EXECUTION IN Q2 Cadre continues to deliver on strategic objectives and capitalize on favorable market trends driving strong demand for mission-critical safety equipment Pricing Growth: ✓ Exceeded target Q2 Mix: − Neutral mix consistent with expectations Orders Backlog: ✓ Stable backlog, excluding new acquisition M&A Execution: ✓ Completed acquisition of multiple leading nuclear brands in April 2025 Healthy M&A Funnel: ✓ Continuing to actively evaluate pipeline of opportunities Returned Capital to Shareholders: ✓ Declared 15th consecutive quarterly dividend Commentary: |
|
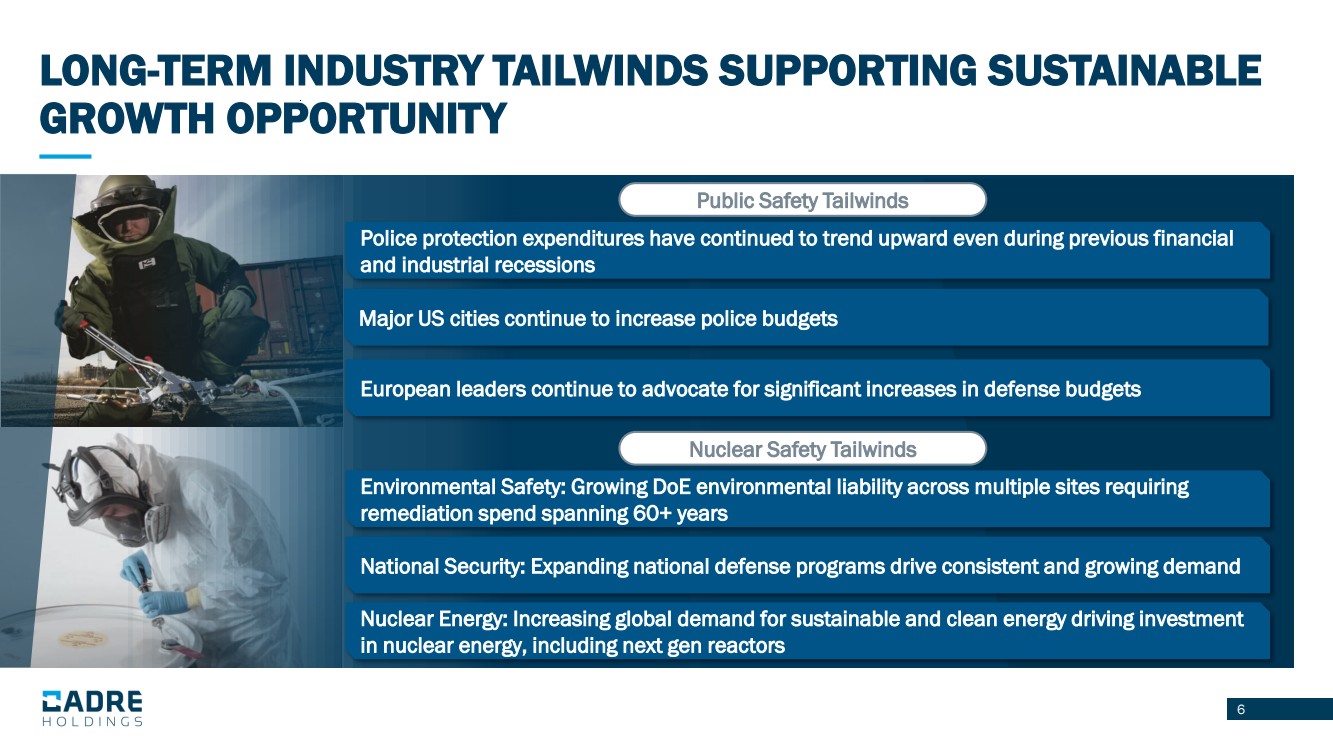
6 LONG-TERM INDUSTRY TAILWINDS SUPPORTING SUSTAINABLE GROWTH OPPORTUNITY Public Safety Tailwinds Nuclear Safety Tailwinds Environmental Safety: Growing DoE environmental liability across multiple sites requiring remediation spend spanning 60+ years National Security: Expanding national defense programs drive consistent and growing demand Nuclear Energy: Increasing global demand for sustainable and clean energy driving investment in nuclear energy, including next gen reactors European leaders continue to advocate for significant increases in defense budgets Police protection expenditures have continued to trend upward even during previous financial and industrial recessions Major US cities continue to increase police budgets |
|
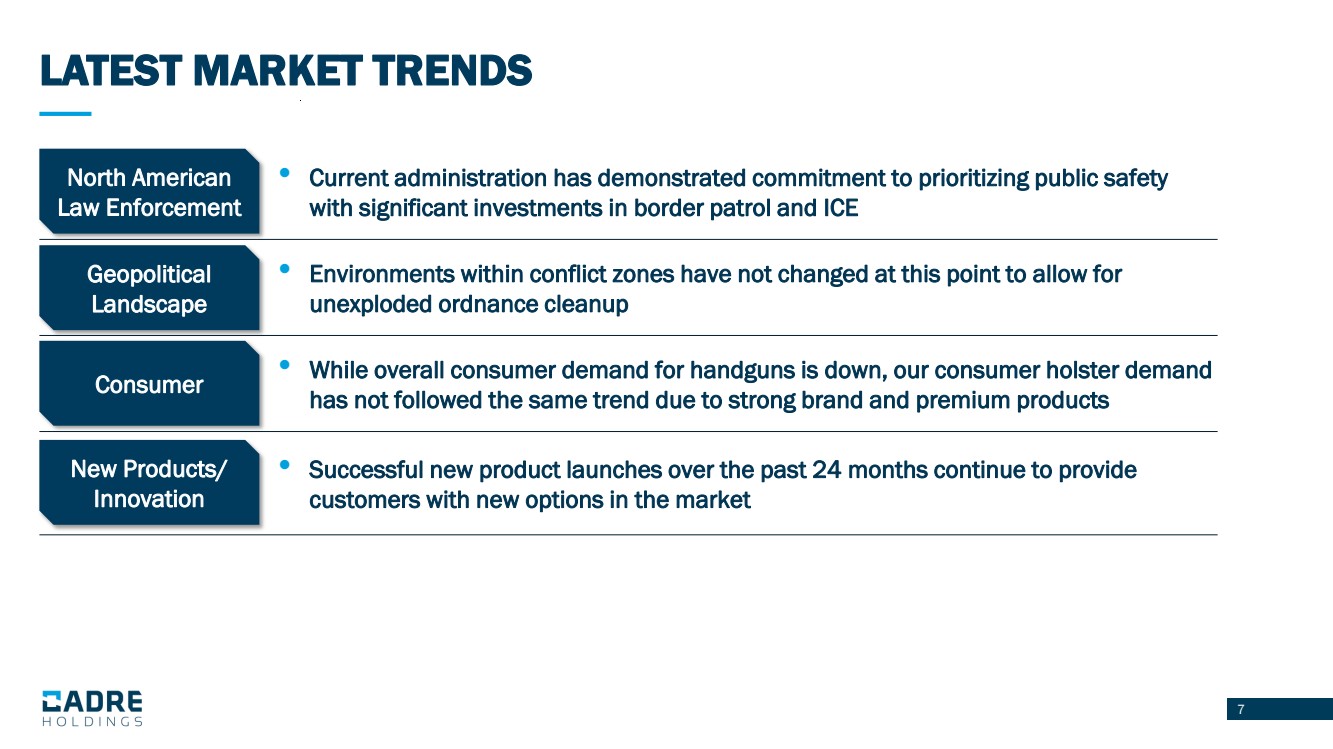
7 • Current administration has demonstrated commitment to prioritizing public safety with significant investments in border patrol and ICE • Environments within conflict zones have not changed at this point to allow for unexploded ordnance cleanup • While overall consumer demand for handguns is down, our consumer holster demand has not followed the same trend due to strong brand and premium products • Successful new product launches over the past 24 months continue to provide customers with new options in the market North American Law Enforcement Geopolitical Landscape Consumer New Products/ Innovation LATEST MARKET TRENDS |
|
8 KEY M&A CRITERIA Business Financial Market Leading market position Cost structure where material > labor High cost of substitution Leading and defensible technology Mission -critical to customer Strong brand recognition Recurring revenue profile Asset -light Attractive ROIC Niche market No large -cap competition Resiliency through market cycles |

|
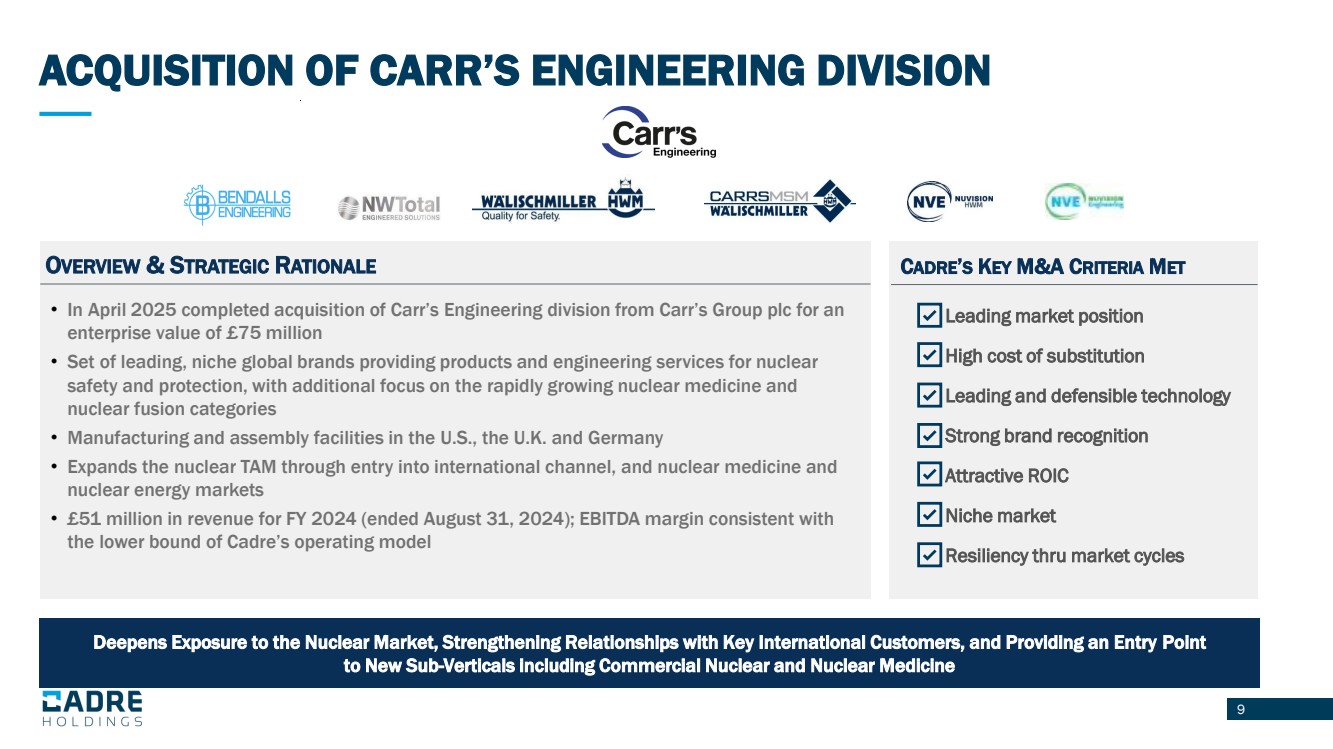
9 Source: Internal Company forecasts ACQUISITION OF CARR’S ENGINEERING DIVISION Deepens Exposure to the Nuclear Market, Strengthening Relationships with Key International Customers, and Providing an Entry Point to New Sub-Verticals including Commercial Nuclear and Nuclear Medicine OVERVIEW & STRATEGIC RATIONALE • Leading market position • High cost of substitution • Leading and defensible technology • Strong brand recognition • Attractive ROIC • Niche market • Resiliency thru market cycles CADRE’S KEY M&A CRITERIA MET • In April 2025 completed acquisition of Carr’s Engineering division from Carr’s Group plc for an enterprise value of £75 million • Set of leading, niche global brands providing products and engineering services for nuclear safety and protection, with additional focus on the rapidly growing nuclear medicine and nuclear fusion categories • Manufacturing and assembly facilities in the U.S., the U.K. and Germany • Expands the nuclear TAM through entry into international channel, and nuclear medicine and nuclear energy markets • £51 million in revenue for FY 2024 (ended August 31, 2024); EBITDA margin consistent with the lower bound of Cadre’s operating model |
|
10 Q2 Financial Results |

|
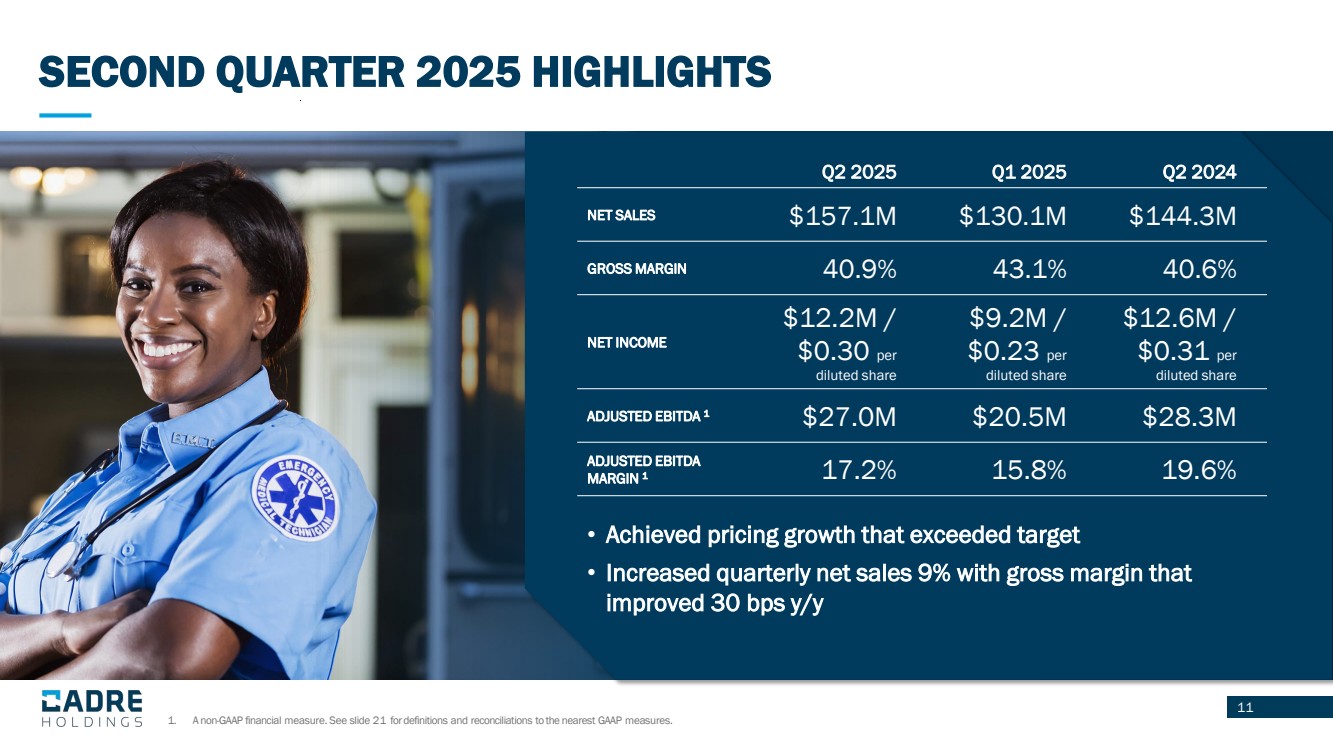
11 • Achieved pricing growth that exceeded target • Increased quarterly net sales 9% with gross margin that improved 30 bps y/y SECOND QUARTER 2025 HIGHLIGHTS Q2 2025 Q1 2025 Q2 2024 NET SALES $157.1M $130.1M $144.3M GROSS MARGIN 40.9% 43.1% 40.6% NET INCOME $12.2M / $0.30 per diluted share $9.2M / $0.23 per diluted share $12.6M / $0.31 per diluted share ADJUSTED EBITDA 1 $27.0M $20.5M $28.3M ADJUSTED EBITDA MARGIN 1 17.2% 15.8% 19.6% 1. A non-GAAP financial measure. See slide 21 for definitions and reconciliations to the nearest GAAP measures. |
|
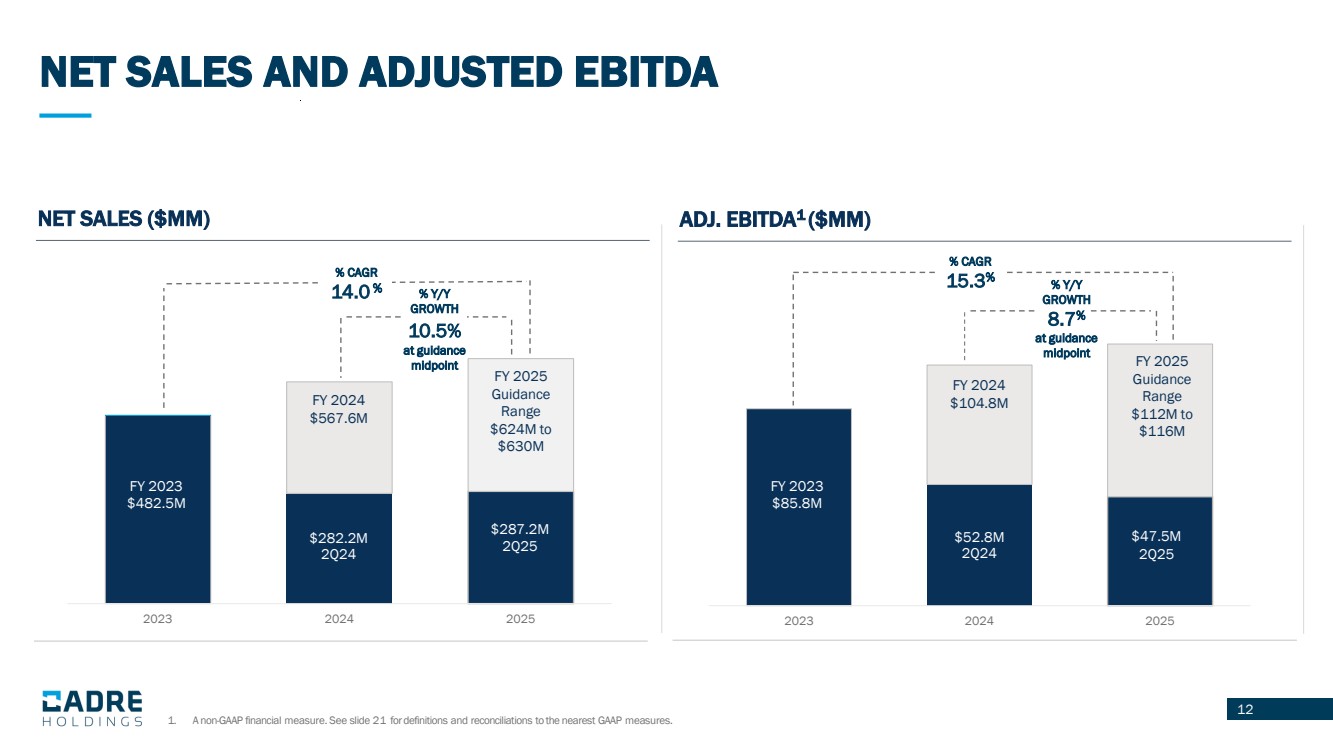
12 NET SALES AND ADJUSTED EBITDA NET SALES ($MM) $282.2M 2Q24 FY 2023 $482.5M 2023 2024 2025 FY 2024 $567.6M ADJ. EBITDA1 ($MM) $52.8M 2Q24 2023 2024 2025 FY 2025 Guidance Range $624M to $630M FY 2025 Guidance Range $112M to $116M % CAGR 14.0 % % Y/Y GROWTH 10.5% at guidance midpoint % CAGR 15.3% % Y/Y GROWTH 8.7% at guidance midpoint $287.2M 2Q25 $47.5M 2Q25 FY 2023 $85.8M FY 2024 $104.8M 1. A non-GAAP financial measure. See slide 21 for definitions and reconciliations to the nearest GAAP measures. |
|
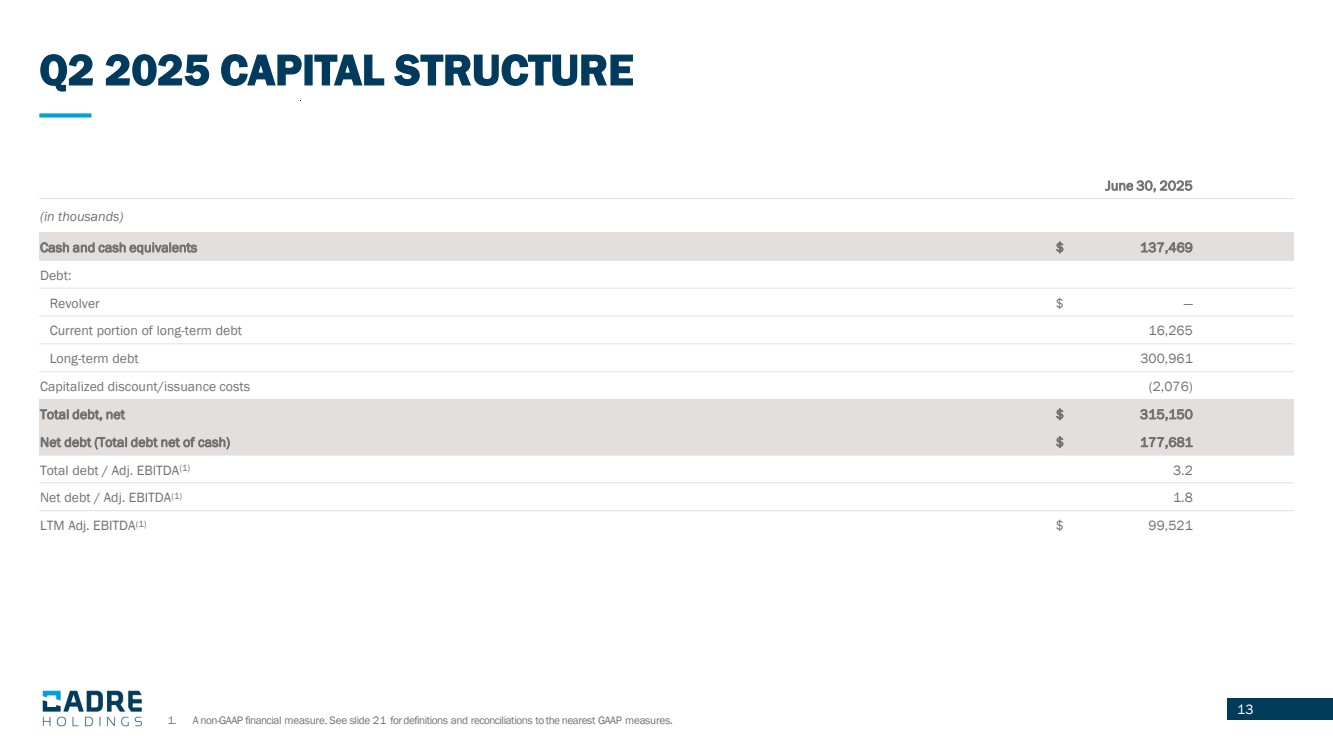
13 Q2 2025 CAPITAL STRUCTURE June 30, 2025 (in thousands) Cash and cash equivalents $ 137,469 Debt: Revolver $ — Current portion of long-term debt 16,265 Long-term debt 300,961 Capitalized discount/issuance costs (2,076) Total debt, net $ 315,150 Net debt (Total debt net of cash) $ 177,681 Total debt / Adj. EBITDA(1) 3.2 Net debt / Adj. EBITDA(1) 1.8 LTM Adj. EBITDA(1) $ 99,521 1. A non-GAAP financial measure. See slide 21 for definitions and reconciliations to the nearest GAAP measures. |
|
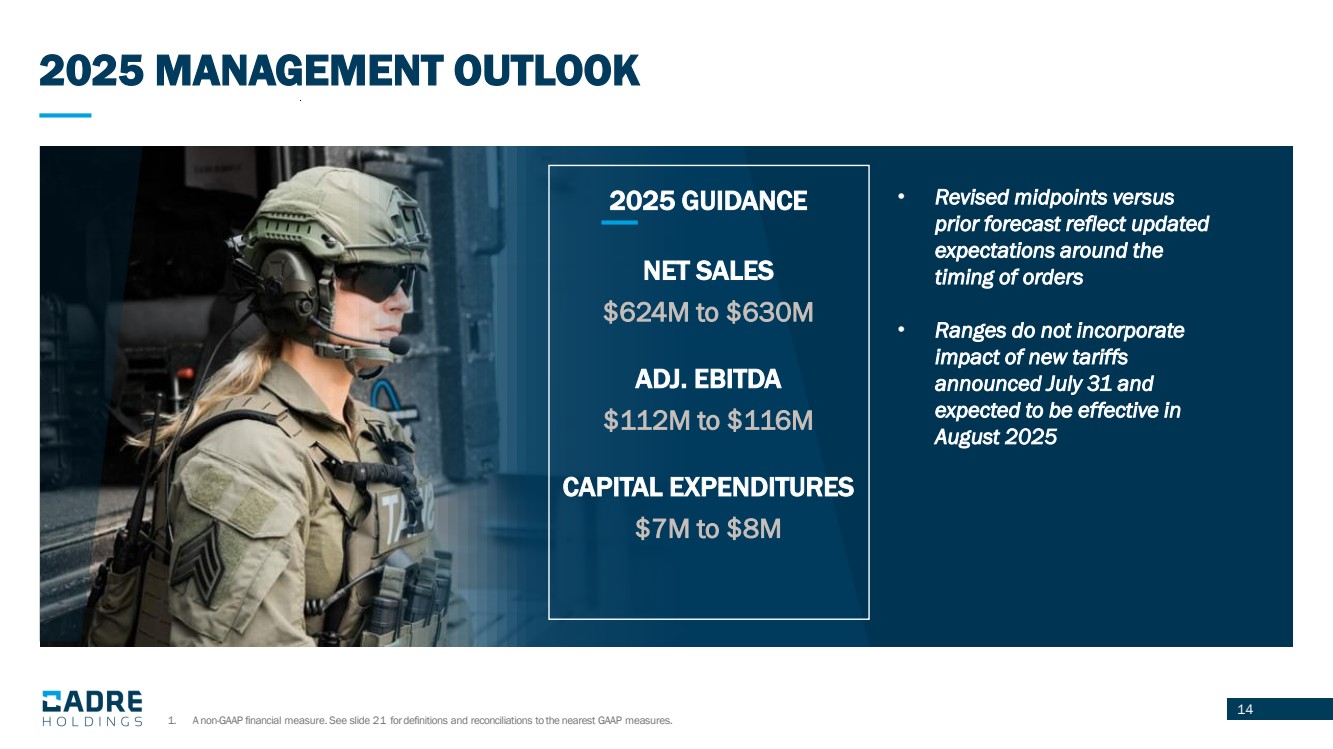
14 2025 MANAGEMENT OUTLOOK • Revised midpoints versus prior forecast reflect updated expectations around the timing of orders • Ranges do not incorporate impact of new tariffs announced July 31 and expected to be effective in August 2025 2025 GUIDANCE NET SALES $624M to $630M ADJ. EBITDA $112M to $116M CAPITAL EXPENDITURES $7M to $8M 1. A non-GAAP financial measure. See slide 21 for definitions and reconciliations to the nearest GAAP measures. |
|
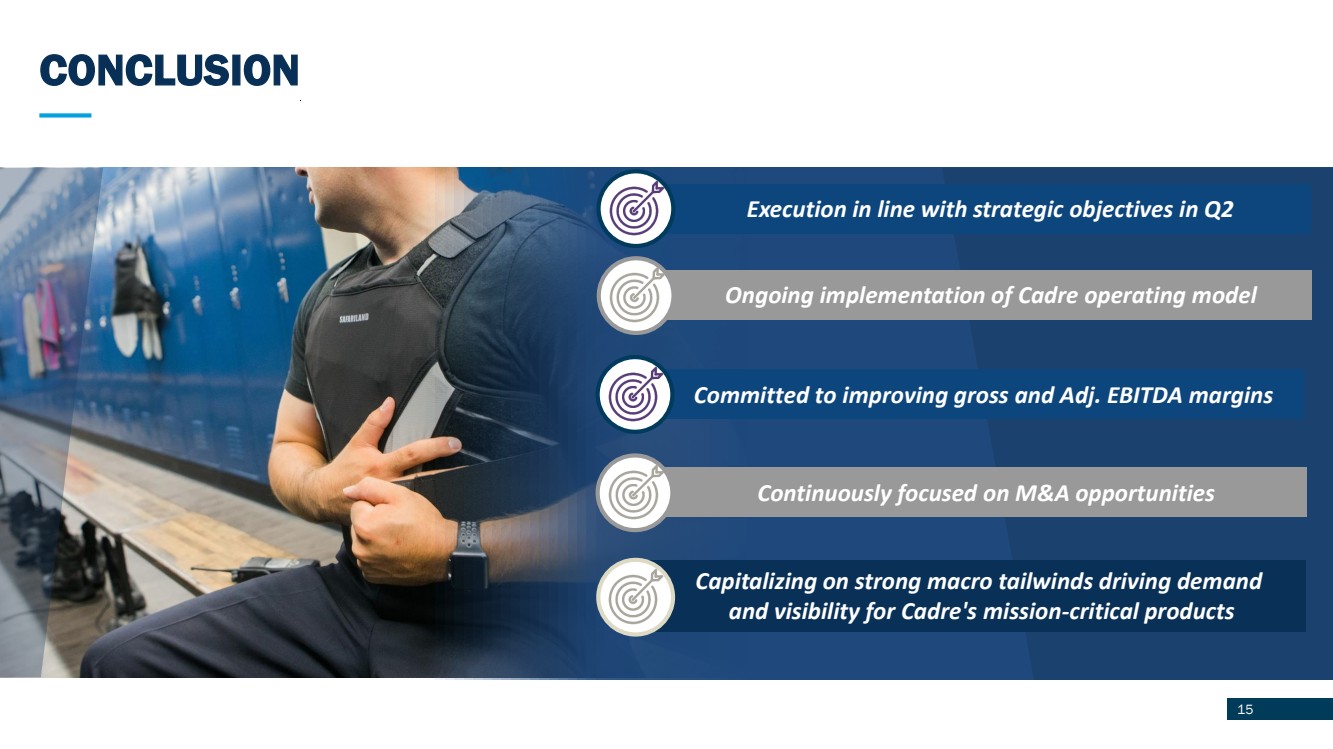
CONCLUSION 15 Execution in line with strategic objectives in Q2 Ongoing implementation of Cadre operating model Committed to improving gross and Adj. EBITDA margins Capitalizing on strong macro tailwinds driving demand and visibility for Cadre's mission-critical products Continuously focused on M&A opportunities |
|
16 APPENDIX |

|
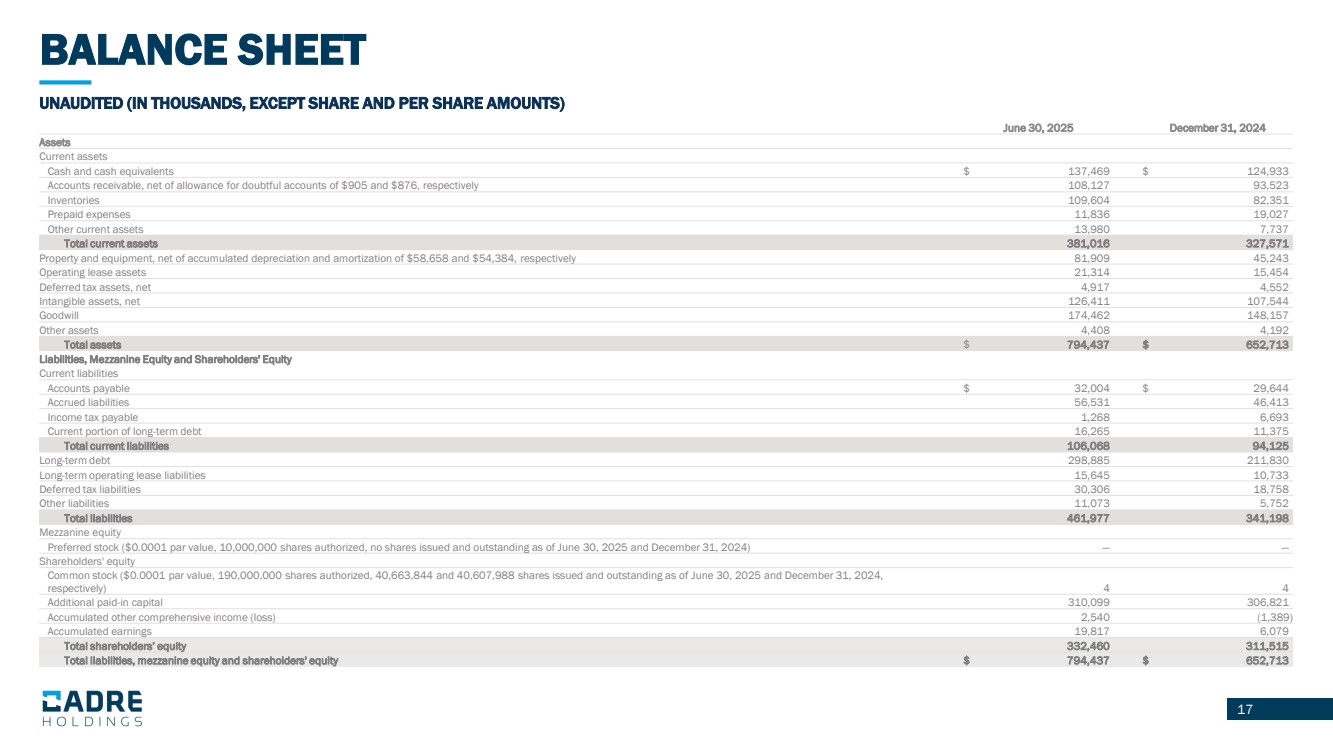
17 BALANCE SHEET UNAUDITED (IN THOUSANDS, EXCEPT SHARE AND PER SHARE AMOUNTS) June 30, 2025 December 31, 2024 Assets Current assets Cash and cash equivalents $ 137,469 $ 124,933 Accounts receivable, net of allowance for doubtful accounts of $905 and $876, respectively 108,127 93,523 Inventories 109,604 82,351 Prepaid expenses 11,836 19,027 Other current assets 13,980 7,737 Total current assets 381,016 327,571 Property and equipment, net of accumulated depreciation and amortization of $58,658 and $54,384, respectively 81,909 45,243 Operating lease assets 21,314 15,454 Deferred tax assets, net 4,917 4,552 Intangible assets, net 126,411 107,544 Goodwill 174,462 148,157 Other assets 4,408 4,192 Total assets $ 794,437 $ 652,713 Liabilities, Mezzanine Equity and Shareholders' Equity Current liabilities Accounts payable $ 32,004 $ 29,644 Accrued liabilities 56,531 46,413 Income tax payable 1,268 6,693 Current portion of long-term debt 16,265 11,375 Total current liabilities 106,068 94,125 Long-term debt 298,885 211,830 Long-term operating lease liabilities 15,645 10,733 Deferred tax liabilities 30,306 18,758 Other liabilities 11,073 5,752 Total liabilities 461,977 341,198 Mezzanine equity Preferred stock ($0.0001 par value, 10,000,000 shares authorized, no shares issued and outstanding as of June 30, 2025 and December 31, 2024) — — Shareholders' equity Common stock ($0.0001 par value, 190,000,000 shares authorized, 40,663,844 and 40,607,988 shares issued and outstanding as of June 30, 2025 and December 31, 2024, respectively) 4 4 Additional paid-in capital 310,099 306,821 Accumulated other comprehensive income (loss) 2,540 (1,389) Accumulated earnings 19,817 6,079 Total shareholders’ equity 332,460 311,515 Total liabilities, mezzanine equity and shareholders' equity $ 794,437 $ 652,713 |
|
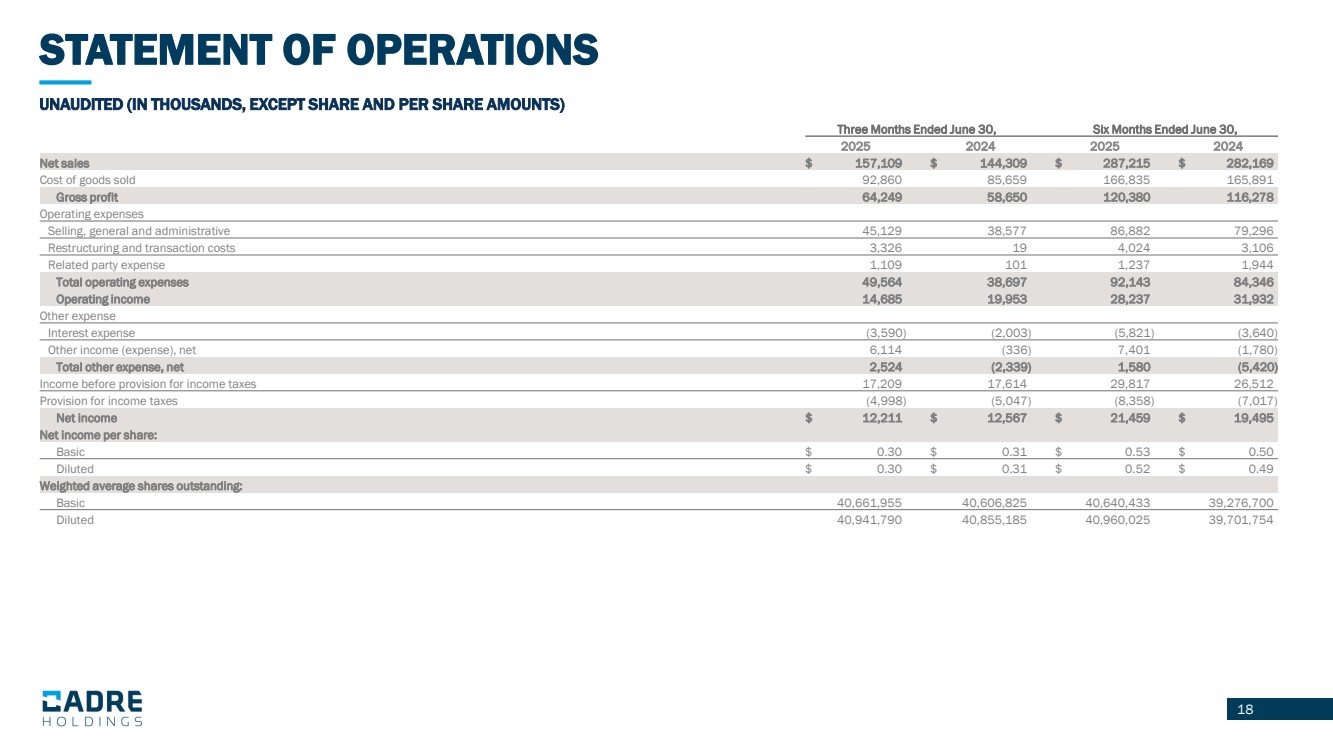
18 UNAUDITED (IN THOUSANDS, EXCEPT SHARE AND PER SHARE AMOUNTS) Three Months Ended June 30, Six Months Ended June 30, 2025 2024 2025 2024 Net sales $ 157,109 $ 144,309 $ 287,215 $ 282,169 Cost of goods sold 92,860 85,659 166,835 165,891 Gross profit 64,249 58,650 120,380 116,278 Operating expenses Selling, general and administrative 45,129 38,577 86,882 79,296 Restructuring and transaction costs 3,326 19 4,024 3,106 Related party expense 1,109 101 1,237 1,944 Total operating expenses 49,564 38,697 92,143 84,346 Operating income 14,685 19,953 28,237 31,932 Other expense Interest expense (3,590) (2,003) (5,821) (3,640) Other income (expense), net 6,114 (336) 7,401 (1,780) Total other expense, net 2,524 (2,339) 1,580 (5,420) Income before provision for income taxes 17,209 17,614 29,817 26,512 Provision for income taxes (4,998) (5,047) (8,358) (7,017) Net income $ 12,211 $ 12,567 $ 21,459 $ 19,495 Net income per share: Basic $ 0.30 $ 0.31 $ 0.53 $ 0.50 Diluted $ 0.30 $ 0.31 $ 0.52 $ 0.49 Weighted average shares outstanding: Basic 40,661,955 40,606,825 40,640,433 39,276,700 Diluted 40,941,790 40,855,185 40,960,025 39,701,754 STATEMENT OF OPERATIONS |
|
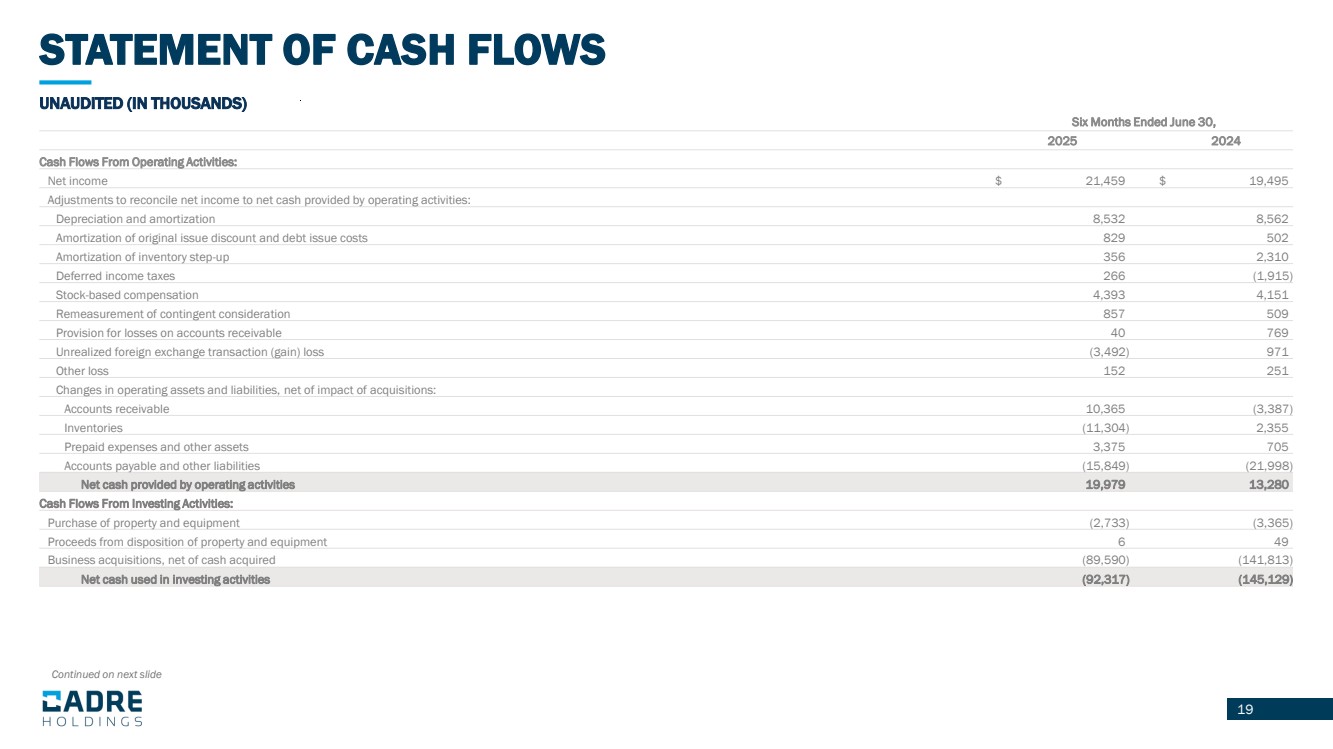
19 UNAUDITED (IN THOUSANDS) Continued on next slide Six Months Ended June 30, 2025 2024 Cash Flows From Operating Activities: Net income $ 21,459 $ 19,495 Adjustments to reconcile net income to net cash provided by operating activities: Depreciation and amortization 8,532 8,562 Amortization of original issue discount and debt issue costs 829 502 Amortization of inventory step-up 356 2,310 Deferred income taxes 266 (1,915) Stock-based compensation 4,393 4,151 Remeasurement of contingent consideration 857 509 Provision for losses on accounts receivable 40 769 Unrealized foreign exchange transaction (gain) loss (3,492) 971 Other loss 152 251 Changes in operating assets and liabilities, net of impact of acquisitions: Accounts receivable 10,365 (3,387) Inventories (11,304) 2,355 Prepaid expenses and other assets 3,375 705 Accounts payable and other liabilities (15,849) (21,998) Net cash provided by operating activities 19,979 13,280 Cash Flows From Investing Activities: Purchase of property and equipment (2,733) (3,365) Proceeds from disposition of property and equipment 6 49 Business acquisitions, net of cash acquired (89,590) (141,813) Net cash used in investing activities (92,317) (145,129) STATEMENT OF CASH FLOWS |
|
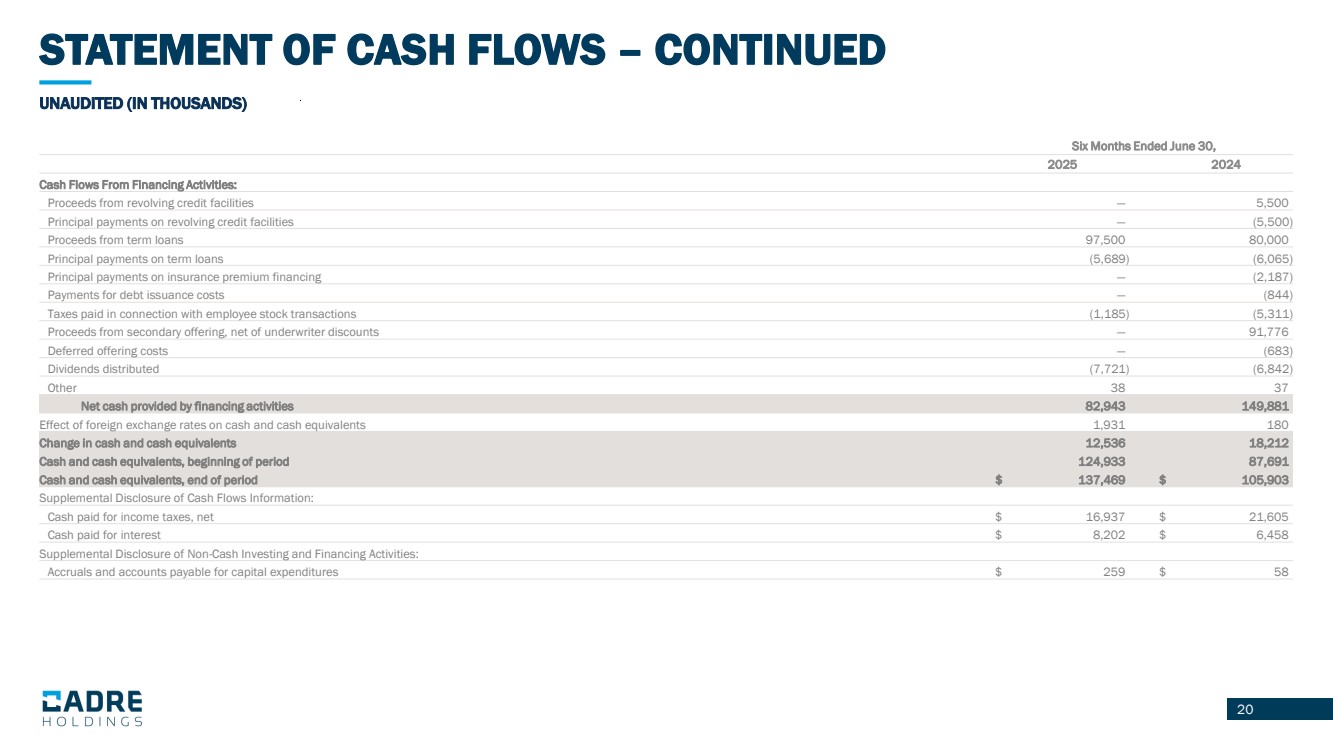
20 UNAUDITED (IN THOUSANDS) Six Months Ended June 30, 2025 2024 Cash Flows From Financing Activities: Proceeds from revolving credit facilities — 5,500 Principal payments on revolving credit facilities — (5,500) Proceeds from term loans 97,500 80,000 Principal payments on term loans (5,689) (6,065) Principal payments on insurance premium financing — (2,187) Payments for debt issuance costs — (844) Taxes paid in connection with employee stock transactions (1,185) (5,311) Proceeds from secondary offering, net of underwriter discounts — 91,776 Deferred offering costs — (683) Dividends distributed (7,721) (6,842) Other 38 37 Net cash provided by financing activities 82,943 149,881 Effect of foreign exchange rates on cash and cash equivalents 1,931 180 Change in cash and cash equivalents 12,536 18,212 Cash and cash equivalents, beginning of period 124,933 87,691 Cash and cash equivalents, end of period $ 137,469 $ 105,903 Supplemental Disclosure of Cash Flows Information: Cash paid for income taxes, net $ 16,937 $ 21,605 Cash paid for interest $ 8,202 $ 6,458 Supplemental Disclosure of Non-Cash Investing and Financing Activities: Accruals and accounts payable for capital expenditures $ 259 $ 58 STATEMENT OF CASH FLOWS – CONTINUED |
|
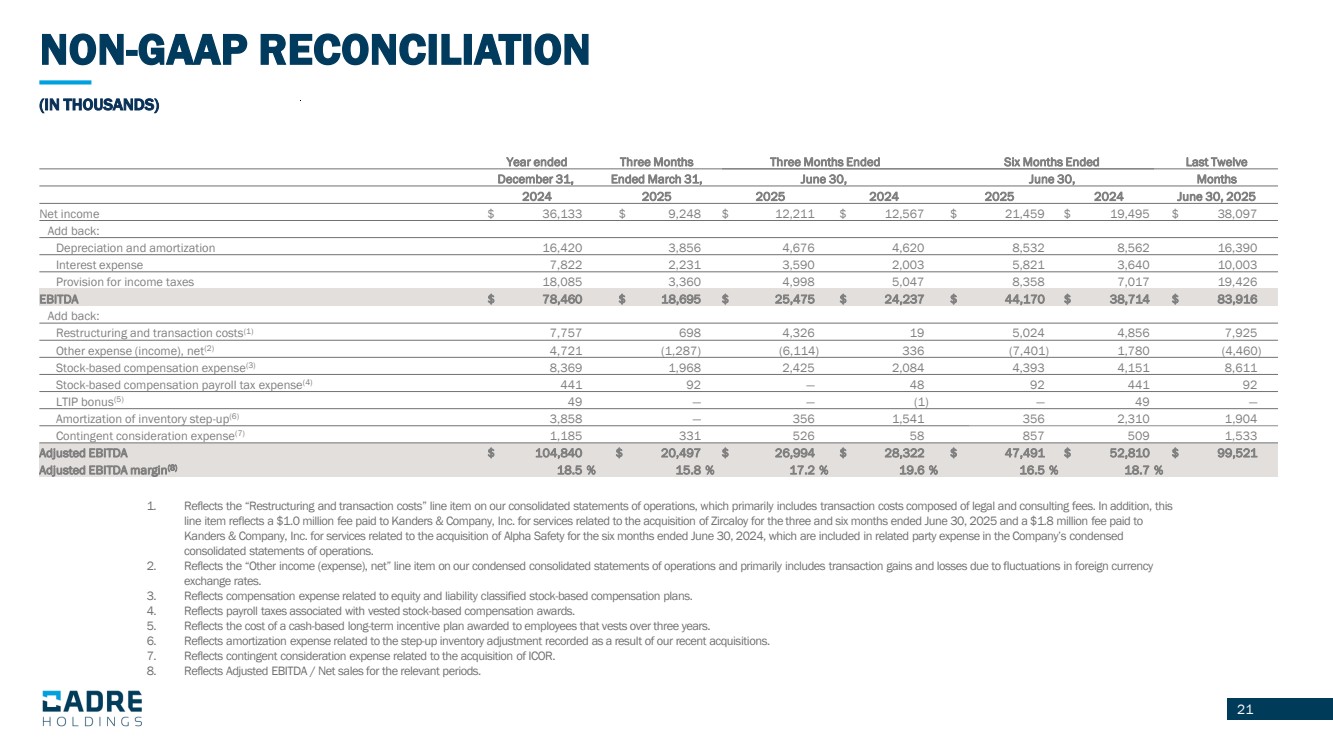
21 1. Reflects the “Restructuring and transaction costs” line item on our consolidated statements of operations, which primarily includes transaction costs composed of legal and consulting fees. In addition, this line item reflects a $1.0 million fee paid to Kanders & Company, Inc. for services related to the acquisition of Zircaloy for the three and six months ended June 30, 2025 and a $1.8 million fee paid to Kanders & Company, Inc. for services related to the acquisition of Alpha Safety for the six months ended June 30, 2024, which are included in related party expense in the Company’s condensed consolidated statements of operations. 2. Reflects the “Other income (expense), net” line item on our condensed consolidated statements of operations and primarily includes transaction gains and losses due to fluctuations in foreign currency exchange rates. 3. Reflects compensation expense related to equity and liability classified stock-based compensation plans. 4. Reflects payroll taxes associated with vested stock-based compensation awards. 5. Reflects the cost of a cash-based long-term incentive plan awarded to employees that vests over three years. 6. Reflects amortization expense related to the step-up inventory adjustment recorded as a result of our recent acquisitions. 7. Reflects contingent consideration expense related to the acquisition of ICOR. 8. Reflects Adjusted EBITDA / Net sales for the relevant periods. 21 (IN THOUSANDS) NON-GAAP RECONCILIATION Year ended Three Months Three Months Ended Six Months Ended Last Twelve December 31, Ended March 31, June 30, June 30, Months 2024 2025 2025 2024 2025 2024 June 30, 2025 Net income $ 36,133 $ 9,248 $ 12,211 $ 12,567 $ 21,459 $ 19,495 $ 38,097 Add back: Depreciation and amortization 16,420 3,856 4,676 4,620 8,532 8,562 16,390 Interest expense 7,822 2,231 3,590 2,003 5,821 3,640 10,003 Provision for income taxes 18,085 3,360 4,998 5,047 8,358 7,017 19,426 EBITDA $ 78,460 $ 18,695 $ 25,475 $ 24,237 $ 44,170 $ 38,714 $ 83,916 Add back: Restructuring and transaction costs(1) 7,757 698 4,326 19 5,024 4,856 7,925 Other expense (income), net(2) 4,721 (1,287) (6,114) 336 (7,401) 1,780 (4,460) Stock-based compensation expense(3) 8,369 1,968 2,425 2,084 4,393 4,151 8,611 Stock-based compensation payroll tax expense(4) 441 92 — 48 92 441 92 LTIP bonus(5) 49 — — (1) — 49 — Amortization of inventory step-up(6) 3,858 — 356 1,541 356 2,310 1,904 Contingent consideration expense(7) 1,185 331 526 58 857 509 1,533 Adjusted EBITDA $ 104,840 $ 20,497 $ 26,994 $ 28,322 $ 47,491 $ 52,810 $ 99,521 Adjusted EBITDA margin(8) 18.5 % 15.8 % 17.2 % 19.6 % 16.5 % 18.7 % |
|
22 The Company reports its financial results in accordance with U.S. generally accepted accounting principles (“GAAP”). The presentation contains the non-GAAP measures: (i) earnings before interest, taxes, other income or expense, depreciation and amortization (“EBITDA”), (ii) adjusted EBITDA and (iii) adjusted EBITDA margin and (iv) last twelve months adjusted EBITDA. The Company believes the presentation of these non-GAAP measures provides useful information for the understanding of its ongoing operations and enables investors to focus on period-over-period operating performance, and thereby enhances the user’s overall understanding of the Company’s current financial performance relative to past performance and provides, along with the nearest GAAP measures, a baseline for modeling future earnings expectations. Non-GAAP measures are reconciled to comparable GAAP financial measures within this presentation. We do not provide a reconciliation of the non-GAAP guidance measure Adjusted EBITDA for the fiscal year 2025 to net income for the fiscal year 2025, the most comparable GAAP financial measure, due to the inherent difficulty of forecasting certain types of expenses and gains, without unreasonable effort, which affect net income but not Adjusted EBITDA. The Company cautions that non-GAAP measures should be considered in addition to, but not as a substitute for, the Company’s reported GAAP results. Additionally, the Company notes that there can be no assurance that the above referenced non-GAAP financial measures are comparable to similarly titled financial measures used by other publicly traded companies. USE OF NON-GAAP MEASURES |