EX-99.2
Published on March 5, 2024
|
FOURTH QUARTER 2023 |

|
2 FORWARD-LOOKING STATEMENTS Except for historical information, certain matters discussed in this press release may be forward-looking statements within the meaning of the Private Securities Litigation Reform Act of 1995. Forward-looking statements include but are not limited to all projections and anticipated levels of future performance. Forward-looking statements involve risks, uncertainties and other factors that may cause our actual results to differ materially from those discussed herein. Any number of factors could cause actual results to differ materially from projections or forward-looking statements, including without limitation, the availability of capital to satisfy our working capital requirements; anticipated trends and challenges in our business and the markets in which we operate; our ability to anticipate market needs or develop new or enhanced products to meet those needs; our expectations regarding market acceptance of our products; the success of competing products by others that are or become available in the market in which we sell our products; the impact of adverse publicity about the Company and/or its brands, including without limitation, through social media or in connection with brand damaging events and/or public perception; changes in political, social, economic or regulatory conditions generally and in the markets in which we operate; our ability to maintain or broaden our business relationships and develop new relationships with strategic alliances, suppliers, customers, distributors or otherwise; our ability to retain and attract senior management and other key employees; our ability to quickly and effectively respond to new technological developments; the effect of an outbreak of disease or similar public health threat, such as the COVID-19 pandemic, on the Company’s business; the possibility that the Company may be adversely affected by other economic, business, and/or competitive factors; the ability of our information technology systems or information security systems to operate effectively, including as a result of security breaches, viruses, hackers, malware, natural disasters, vendor business interruptions or other causes; 2 |
|
3 FORWARD-LOOKING STATEMENTS - CONTINUED our ability to properly maintain, protect, repair or upgrade our information technology systems or information security systems, or problems with our transitioning to upgraded or replacement systems; our ability to protect our trade secrets or other proprietary rights and operate without infringing upon the proprietary rights of others and prevent others from infringing on the proprietary rights of the Company; our ability to maintain a quarterly dividend; logistical challenges related to supply chain disruptions and delays; the impact of inflation; the increased expenses associated with being a public company; and the related increased disclosure and reporting obligations; our ability to integrate the operations of the businesses we have acquired, including, without limitation, ICOR Technology Inc. and Alpha Safety, and may acquire in the future; and any material differences in the actual financial results of the Company’s past and future acquisitions as compared with the Company’s expectation. More information on potential factors that could affect the Company’s financial results are more fully described from time to time in the Company’s public reports filed with the Securities and Exchange Commission, including the Company’s Annual Report on Form 10-K, Quarterly Reports on Form 10-Q, and Current Reports on Form 8-K. All forward-looking statements included in this press release are based upon information available to the Company as of the date of this press release, and speak only as of the date hereof. We assume no obligation to update any forward-looking statements to reflect events or circumstances after the date of this press release. 2 |
|
TODAY’S PRESENTERS 4 BRAD WILLIAMS President BLAINE BROWERS Chief Financial Officer WARREN KANDERS Chief Executive Officer and Chairman of the Board |

|
5 AGENDA • Q4 and FY Highlights • Business Overview • Financial Summary • Full Year Outlook • Conclusion and Q&A |
|
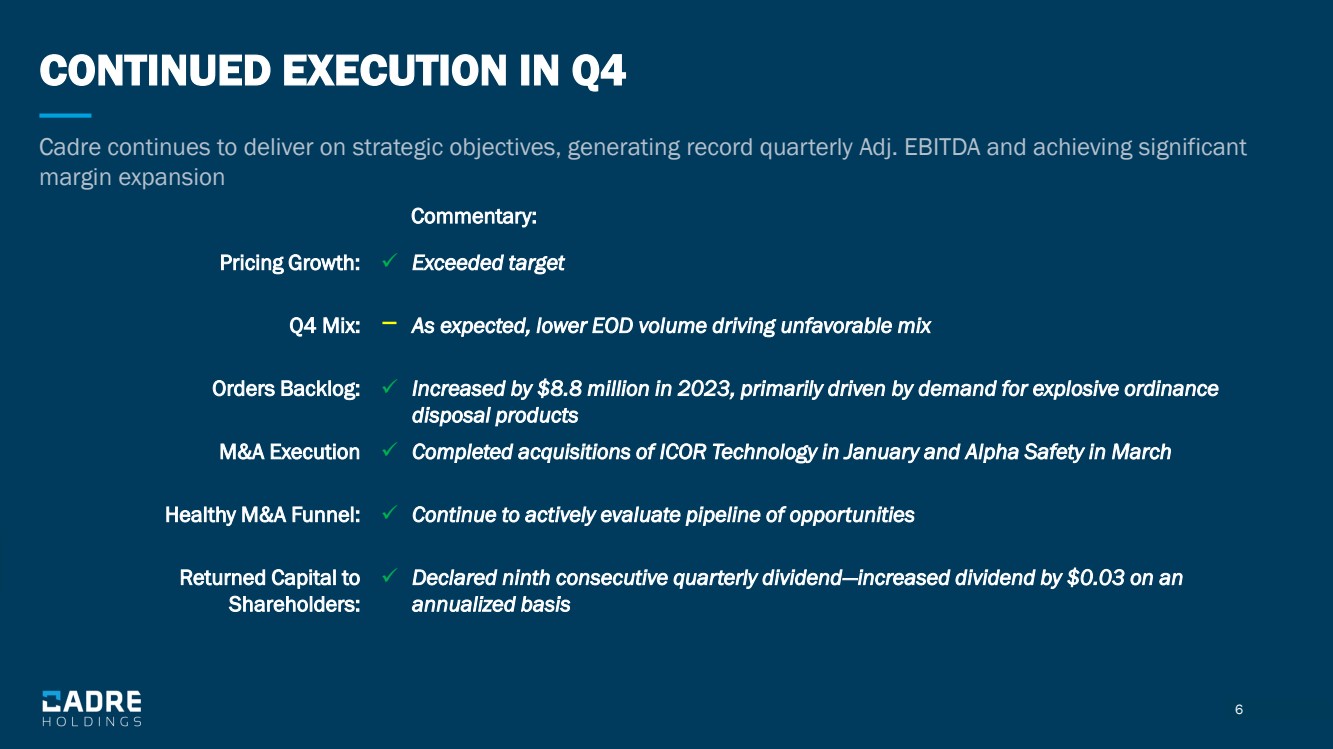
6 CONTINUED EXECUTION IN Q4 Cadre continues to deliver on strategic objectives, generating record quarterly Adj. EBITDA and achieving significant margin expansion Pricing Growth: ✓ Exceeded target Q4 Mix: − As expected, lower EOD volume driving unfavorable mix Orders Backlog: ✓ Increased by $8.8 million in 2023, primarily driven by demand for explosive ordinance disposal products M&A Execution ✓ Completed acquisitions of ICOR Technology in January and Alpha Safety in March Healthy M&A Funnel: ✓ Continue to actively evaluate pipeline of opportunities Returned Capital to Shareholders: ✓ Declared ninth consecutive quarterly dividend—increased dividend by $0.03 on an annualized basis Commentary: |
|
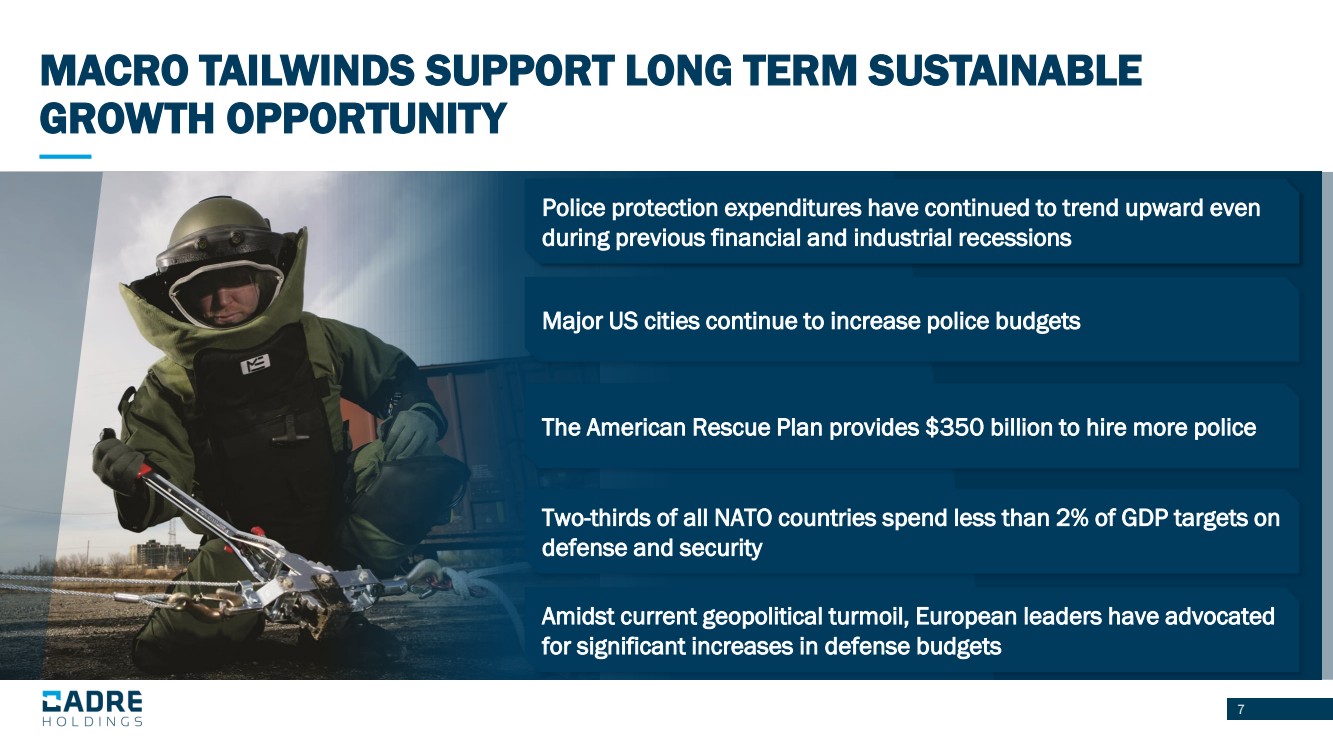
7 MACRO TAILWINDS SUPPORT LONG TERM SUSTAINABLE GROWTH OPPORTUNITY Two-thirds of all NATO countries spend less than 2% of GDP targets on defense and security Amidst current geopolitical turmoil, European leaders have advocated for significant increases in defense budgets Police protection expenditures have continued to trend upward even during previous financial and industrial recessions Major US cities continue to increase police budgets The American Rescue Plan provides $350 billion to hire more police |
|
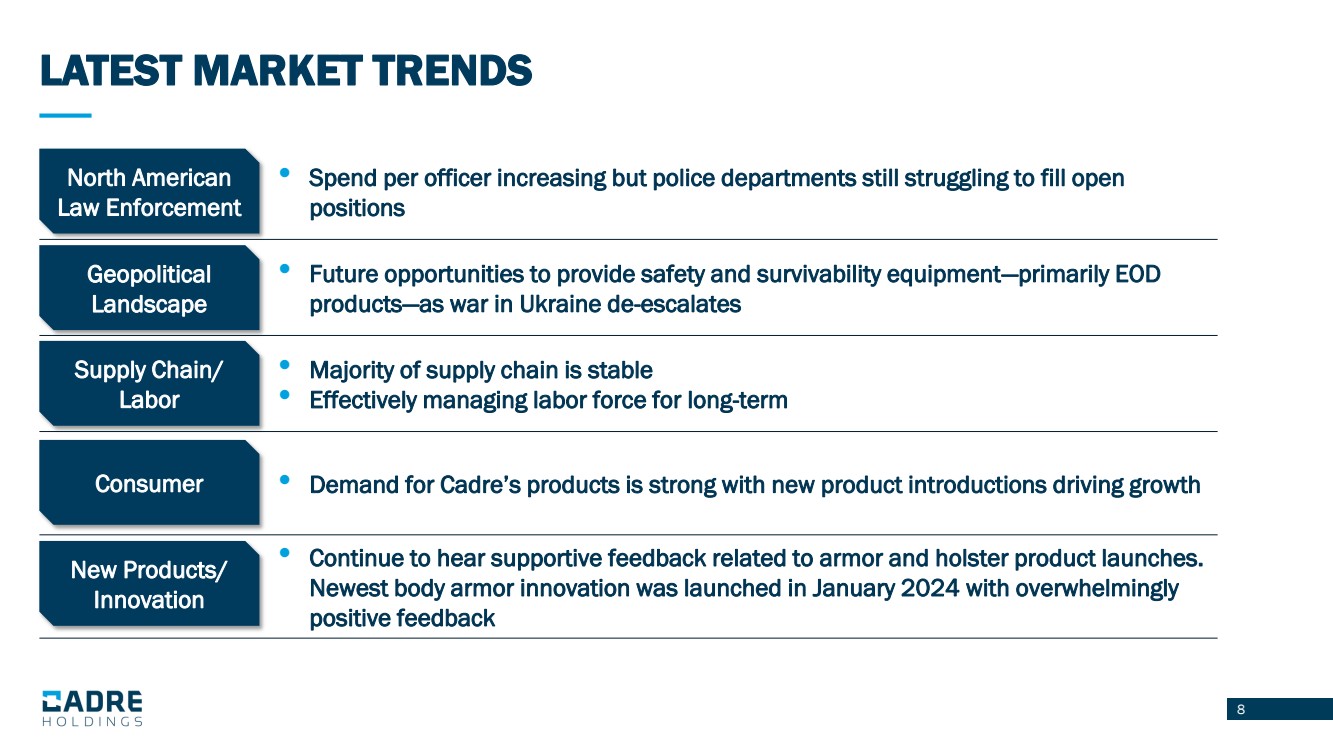
8 • Spend per officer increasing but police departments still struggling to fill open positions • Future opportunities to provide safety and survivability equipment—primarily EOD products—as war in Ukraine de-escalates • Majority of supply chain is stable • Effectively managing labor force for long-term • Demand for Cadre’s products is strong with new product introductions driving growth • Continue to hear supportive feedback related to armor and holster product launches. Newest body armor innovation was launched in January 2024 with overwhelmingly positive feedback North American Law Enforcement Geopolitical Landscape Supply Chain/ Labor Consumer LATEST MARKET TRENDS New Products/ Innovation |
|
9 M&A |
|
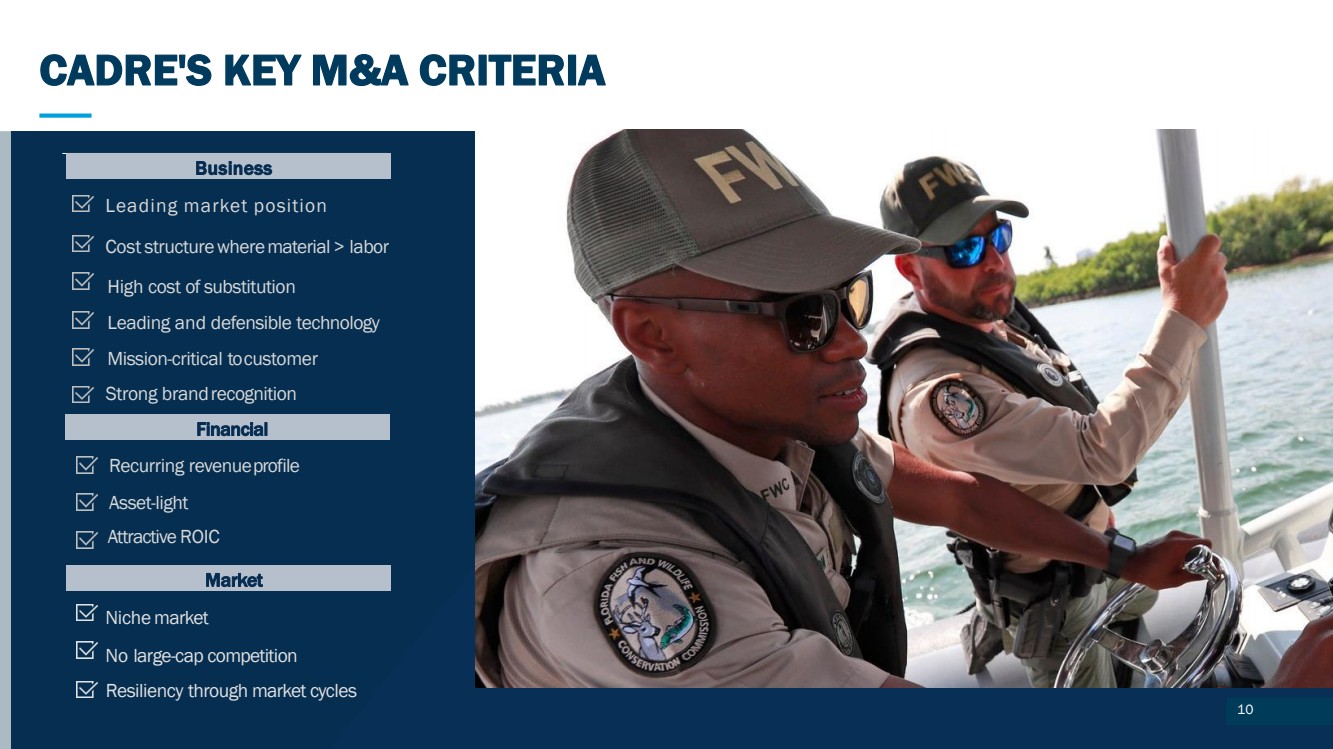
101320 CADRE'S KEY M&ACRITERIA Niche market No large-cap competition Leading market position Cost structurewherematerial> labor Leading and defensible technology High cost of substitution Mission-critical tocustomer Recurring revenueprofile Asset-light Business Financial Market Strong brandrecognition Attractive ROIC Resiliency through market cycles CADRE'S KEY M&A CRITERIA 10 |
|
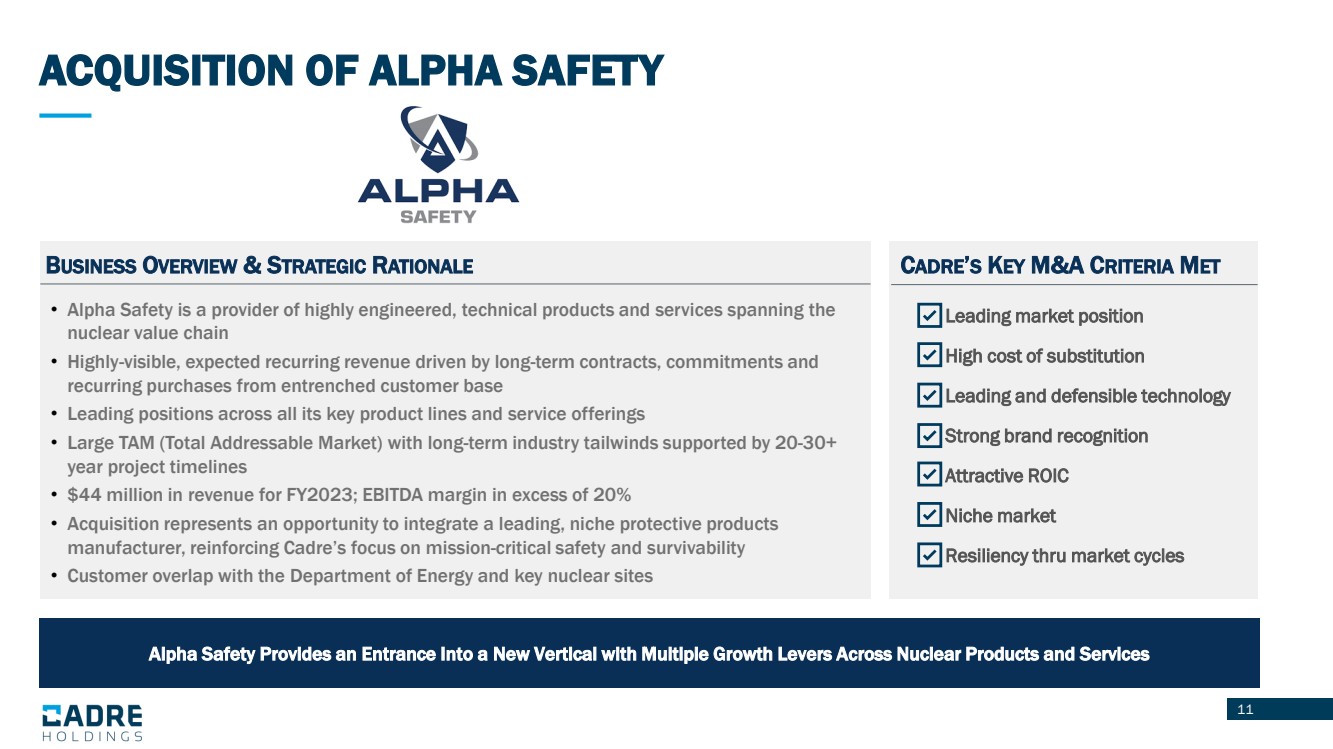
11 Source: Internal Company forecasts ACQUISITION OF ALPHA SAFETY Alpha Safety Provides an Entrance Into a New Vertical with Multiple Growth Levers Across Nuclear Products and Services BUSINESS OVERVIEW & STRATEGIC RATIONALE • Leading market position • High cost of substitution • Leading and defensible technology • Strong brand recognition • Attractive ROIC • Niche market • Resiliency thru market cycles CADRE’S KEY M&A CRITERIA MET • Alpha Safety is a provider of highly engineered, technical products and services spanning the nuclear value chain • Highly-visible, expected recurring revenue driven by long-term contracts, commitments and recurring purchases from entrenched customer base • Leading positions across all its key product lines and service offerings • Large TAM (Total Addressable Market) with long-term industry tailwinds supported by 20-30+ year project timelines • $44 million in revenue for FY2023; EBITDA margin in excess of 20% • Acquisition represents an opportunity to integrate a leading, niche protective products manufacturer, reinforcing Cadre’s focus on mission-critical safety and survivability • Customer overlap with the Department of Energy and key nuclear sites |
|
12 Alpha Safety’s Products/Services Span the Nuclear Value Chain; Supporting Commercial and Government Missions with Radioactive Elements PRODUCT AND SERVICE OVERVIEW Ventilation and Containment Engineered Containers Overview: Equipment and systems to contain and control radioactive and potentially hazardous contaminants Products / Services: Air filtration and carbon adsorber systems modular containment systems and nuclear shielding Advanced Transportation Containers Specialty Filters / Consumable Products Radiometric Instrumentation Field Services and Maintenance Overview: Proprietary containers for handling and storing plutonium oxides, metals, powders and by products Products / Services: Container system enabled by proprietary filter technology co-developed with DoE / NNSA with all IP owned by Alpha Overview: Leader in nuclear material non-destructive assay testing services, flammable gas analysis for testing nuclear waste, and other maintenance Products / Services: Technical services for waste / radioactive material characterization, flammable gas analysis, contracted on annual container maintenance, and other technical onsite services Overview: Solutions for transporting and long-term storage of radioactive materials and nuclear waste Products / Services: Leading U.S. manufacturer of certain advanced containers for transporting and safe disposal of plutonium and related hazardous materials Overview: Products and solutions built for the handling and transportation of radioactive material and release of flammable gases from waste drums Products / Services: Filters, containers, bags and other consumables Overview: Products for monitoring radioactive material and assessing its composition and characteristics Products / Services: systems include standard and custom non-destructive assay solutions and criticality accident and alarm systems |

|
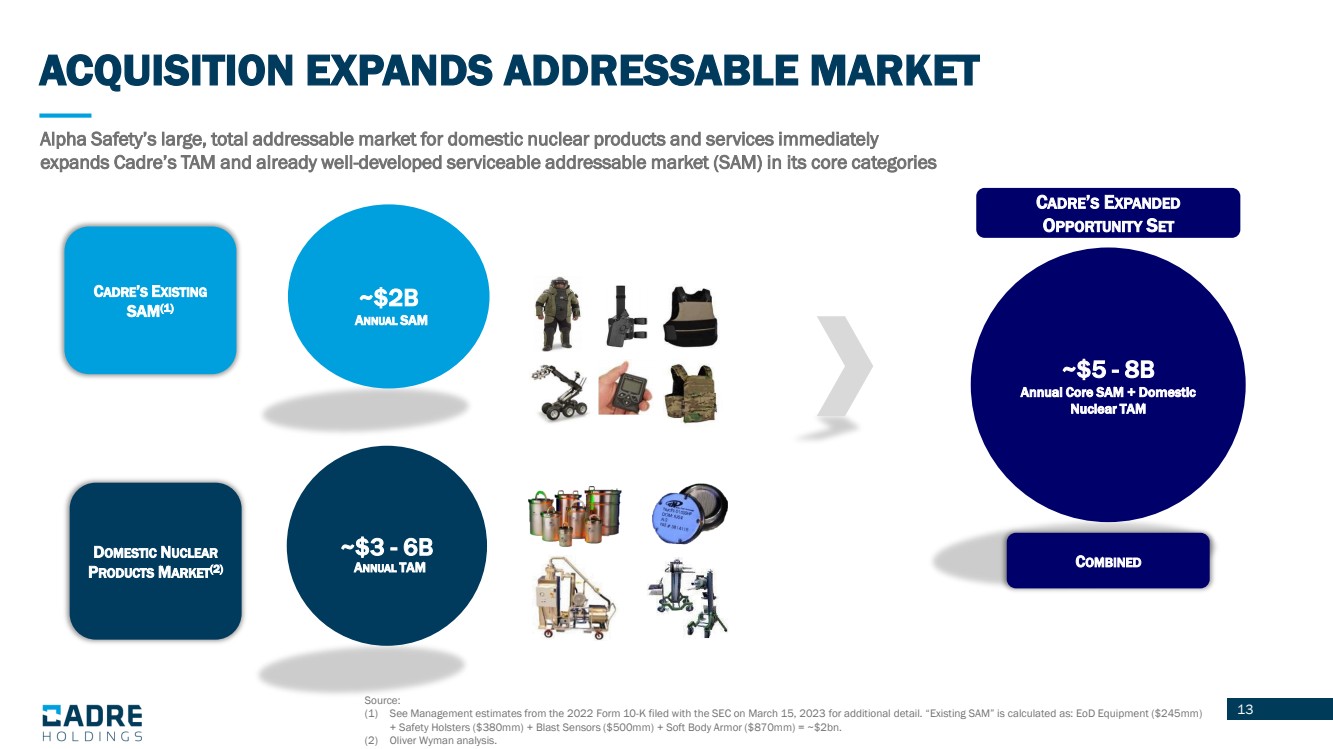
13 Source: Internal Company forecasts ACQUISITION EXPANDS ADDRESSABLE MARKET Source: (1) See Management estimates from the 2022 Form 10-K filed with the SEC on March 15, 2023 for additional detail. “Existing SAM” is calculated as: EoD Equipment ($245mm) + Safety Holsters ($380mm) + Blast Sensors ($500mm) + Soft Body Armor ($870mm) = ~$2bn. (2) Oliver Wyman analysis. ~$2B ANNUAL SAM CADRE’S EXISTING SAM(1) CADRE’S EXPANDED OPPORTUNITY SET ~$5 - 8B Annual Core SAM + Domestic Nuclear TAM COMBINED ~$3 - 6B ANNUAL TAM DOMESTIC NUCLEAR PRODUCTS MARKET(2) Alpha Safety’s large, total addressable market for domestic nuclear products and services immediately expands Cadre’s TAM and already well-developed serviceable addressable market (SAM) in its core categories |
|
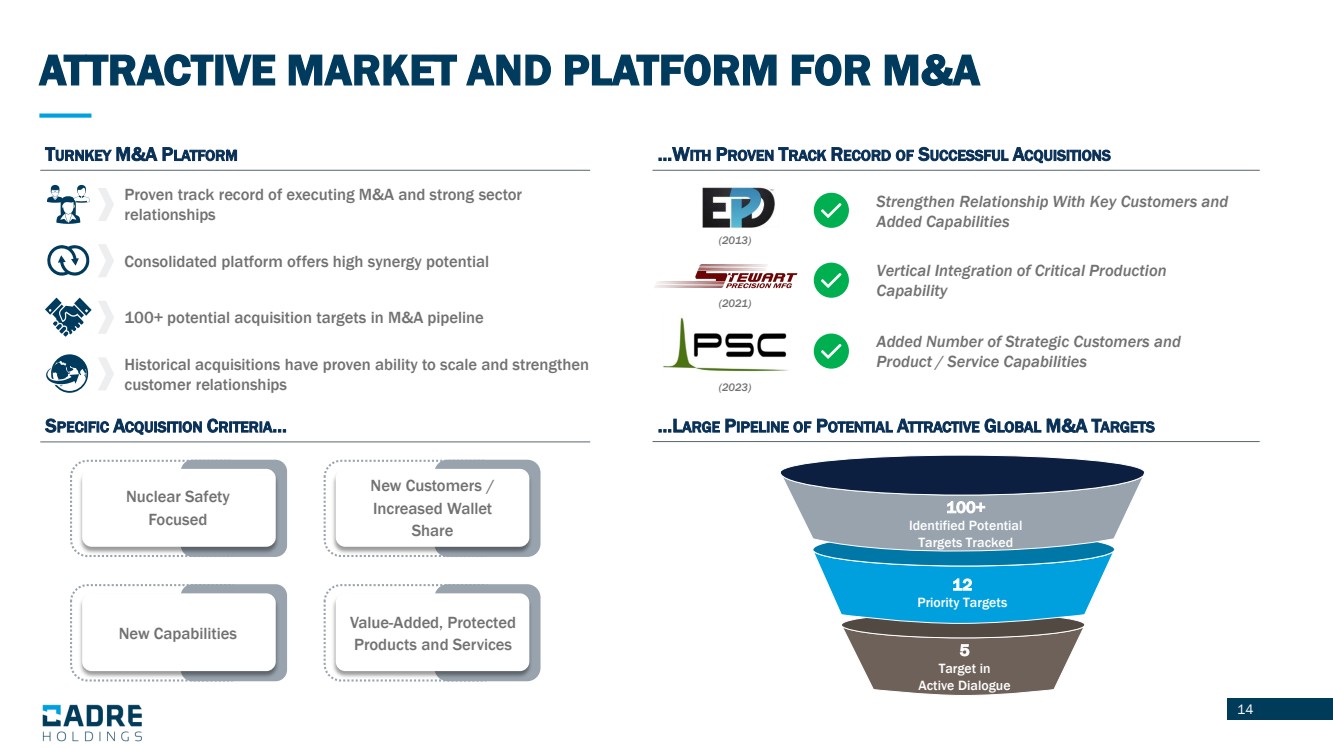
14 Source: Internal Company forecasts ATTRACTIVE MARKET AND PLATFORM FOR M&A TURNKEY M&A PLATFORM Proven track record of executing M&A and strong sector relationships Consolidated platform offers high synergy potential 100+ potential acquisition targets in M&A pipeline Historical acquisitions have proven ability to scale and strengthen customer relationships SPECIFIC ACQUISITION CRITERIA… …LARGE PIPELINE OF POTENTIAL ATTRACTIVE GLOBAL M&A TARGETS …WITH PROVEN TRACK RECORD OF SUCCESSFUL ACQUISITIONS Strengthen Relationship With Key Customers and Added Capabilities Vertical Integration of Critical Production Capability Added Number of Strategic Customers and Product / Service Capabilities (2013) (2021) (2023) New Capabilities Nuclear Safety Focused New Customers / Increased Wallet Share Value-Added, Protected Products and Services 12 Priority Targets 5 Target in Active Dialogue 100+ Identified Potential Targets Tracked |
|
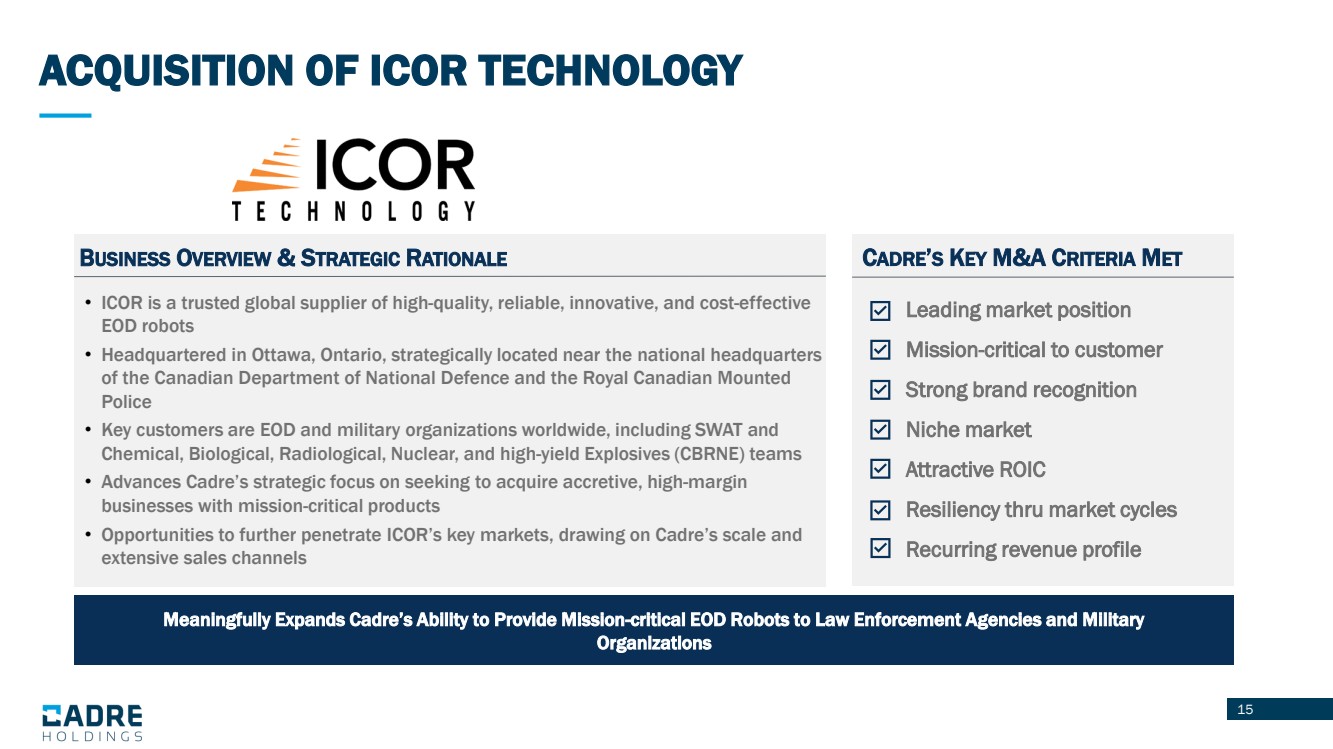
15 Source: Internal Company forecasts ACQUISITION OF ICOR TECHNOLOGY Meaningfully Expands Cadre’s Ability to Provide Mission-critical EOD Robots to Law Enforcement Agencies and Military Organizations BUSINESS OVERVIEW & STRATEGIC RATIONALE • ICOR is a trusted global supplier of high-quality, reliable, innovative, and cost-effective EOD robots • Headquartered in Ottawa, Ontario, strategically located near the national headquarters of the Canadian Department of National Defence and the Royal Canadian Mounted Police • Key customers are EOD and military organizations worldwide, including SWAT and Chemical, Biological, Radiological, Nuclear, and high-yield Explosives (CBRNE) teams • Advances Cadre’s strategic focus on seeking to acquire accretive, high-margin businesses with mission-critical products • Opportunities to further penetrate ICOR’s key markets, drawing on Cadre’s scale and extensive sales channels Leading market position Mission-critical to customer Strong brand recognition Niche market Attractive ROIC Resiliency thru market cycles Recurring revenue profile CADRE’S KEY M&A CRITERIA MET |
|
16 Q4 Financial Results |
|
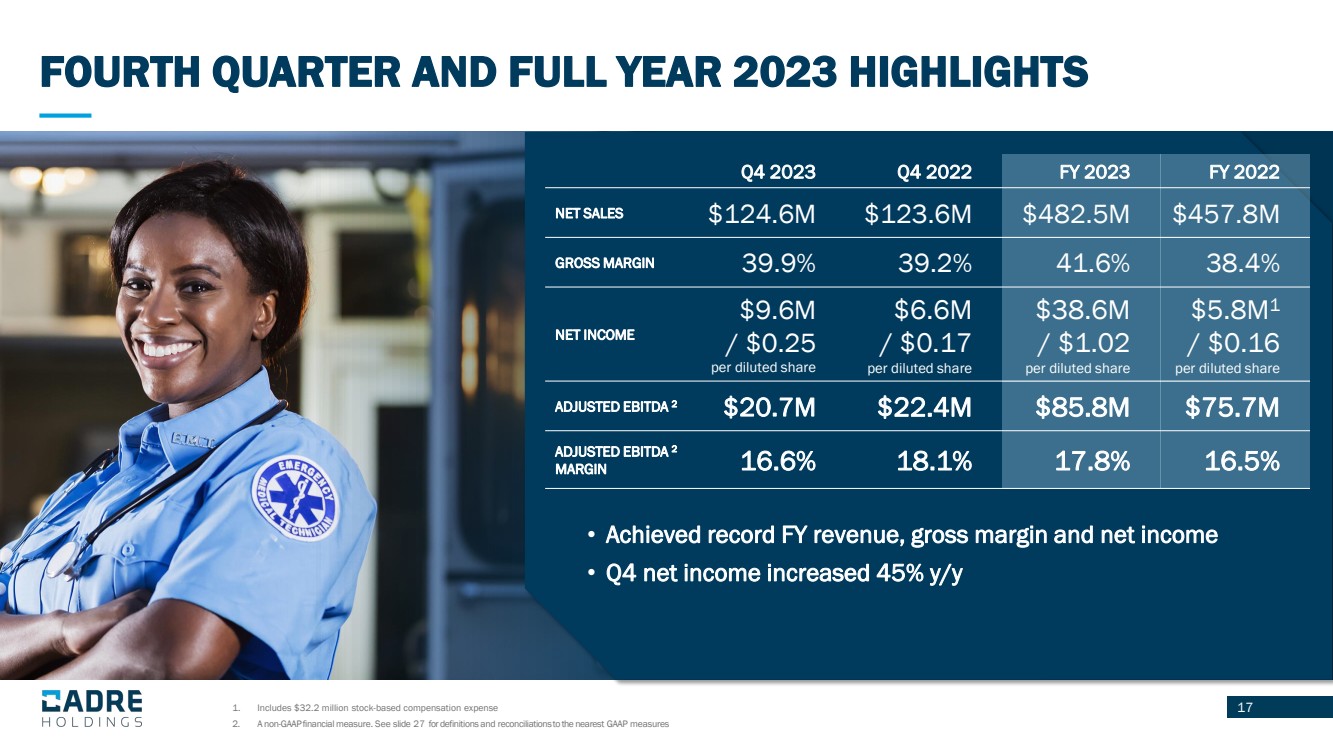
1. Includes $32.2 million stock-based compensation expense 17 2. A non-GAAP financial measure. See slide 27 for definitions and reconciliations to the nearest GAAP measures Q4 2023 Q4 2022 FY 2023 FY 2022 NET SALES $124.6M $123.6M $482.5M $457.8M GROSS MARGIN 39.9% 39.2% 41.6% 38.4% NET INCOME $9.6M / $0.25 per diluted share $6.6M / $0.17 per diluted share $38.6M / $1.02 per diluted share $5.8M1 / $0.16 per diluted share ADJUSTED EBITDA 2 $20.7M $22.4M $85.8M $75.7M ADJUSTED EBITDA 2 MARGIN 16.6% 18.1% 17.8% 16.5% • Achieved record FY revenue, gross margin and net income • Q4 net income increased 45% y/y FOURTH QUARTER AND FULL YEAR 2023 HIGHLIGHTS |
|
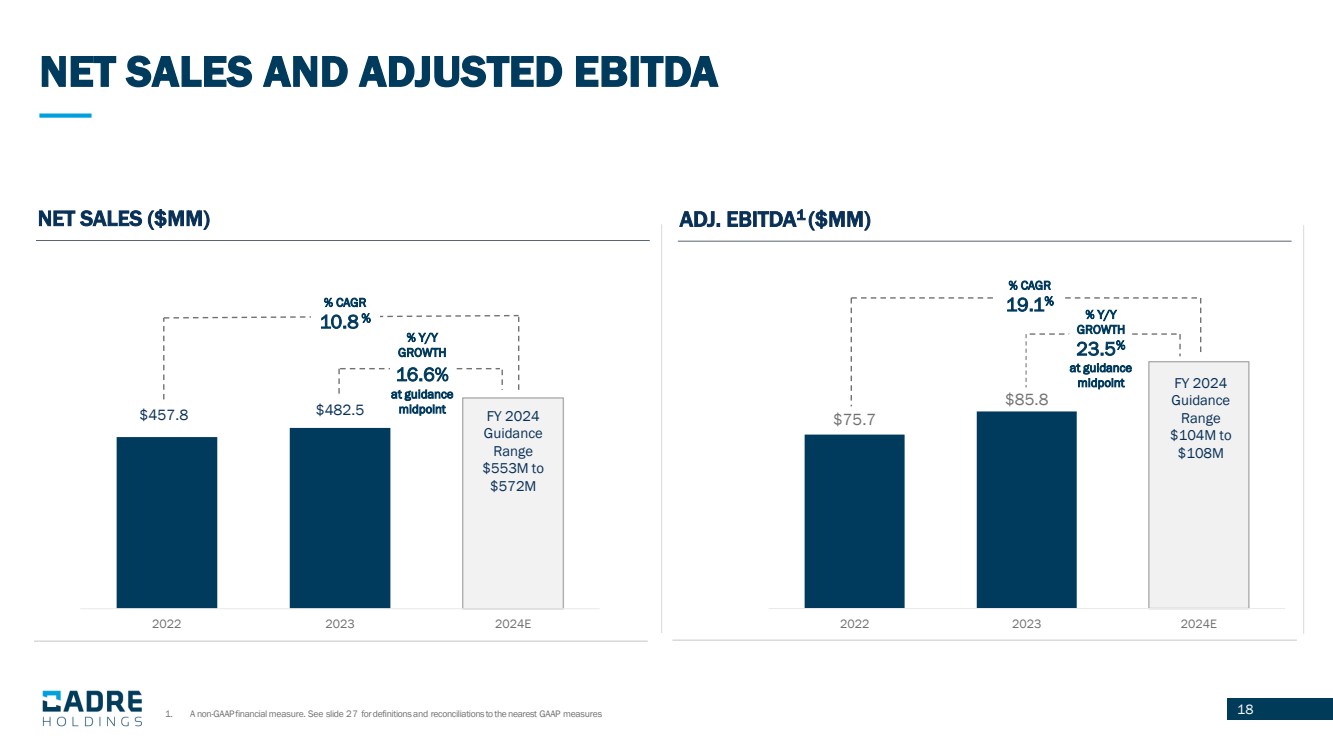
18 NET SALES AND ADJUSTED EBITDA 1. A non-GAAP financial measure. See slide 27 for definitions and reconciliations to the nearest GAAP measures NET SALES ($MM) $457.8 $482.5 2022 2023 2024E ADJ. EBITDA1 ($MM) $75.7 $85.8 2022 2023 2024E FY 2024 Guidance Range $553M to $572M FY 2024 Guidance Range $104M to $108M % CAGR 10.8 % % Y/Y GROWTH 16.6% at guidance midpoint % CAGR 19.1% % Y/Y GROWTH 23.5% at guidance midpoint |
|
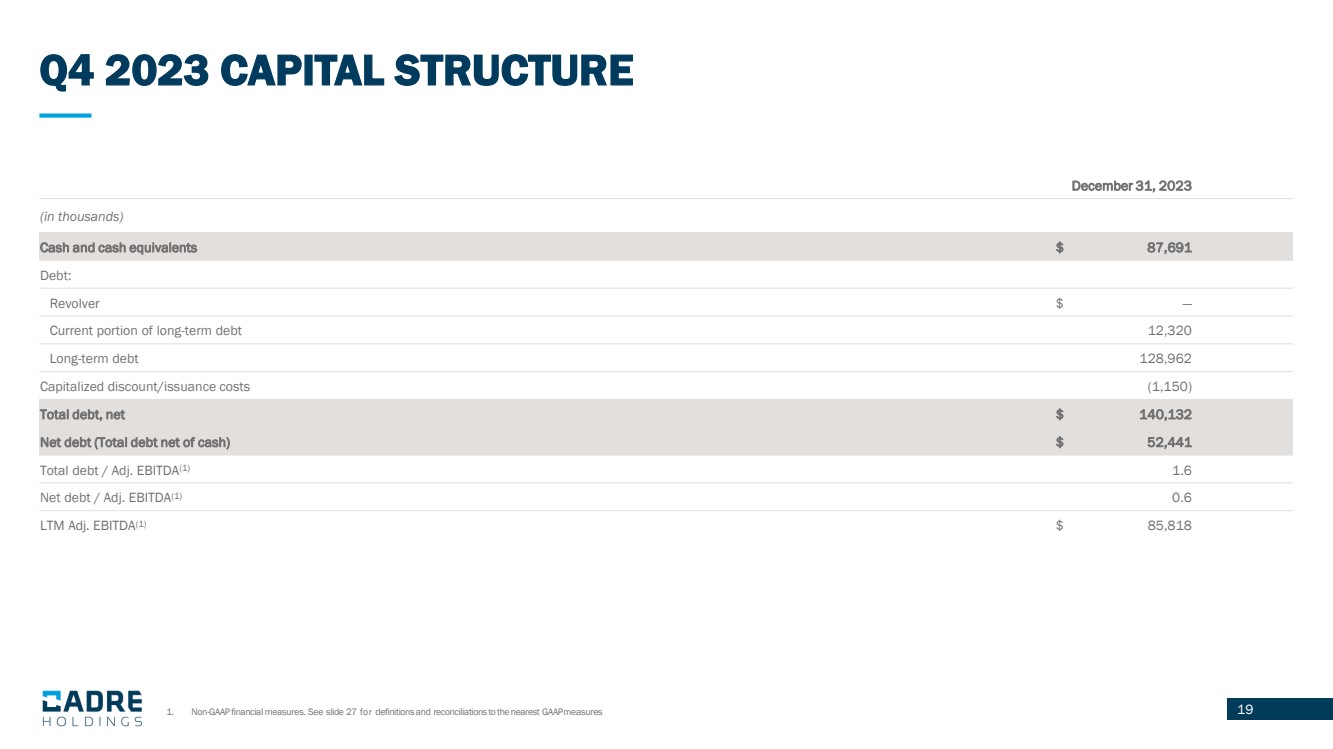
19 Q4 2023 CAPITAL STRUCTURE 1. Non-GAAP financial measures. See slide 27 for definitions and reconciliations to the nearest GAAPmeasures December 31, 2023 (in thousands) Cash and cash equivalents $ 87,691 Debt: Revolver $ — Current portion of long-term debt 12,320 Long-term debt 128,962 Capitalized discount/issuance costs (1,150) Total debt, net $ 140,132 Net debt (Total debt net of cash) $ 52,441 Total debt / Adj. EBITDA(1) 1.6 Net debt / Adj. EBITDA(1) 0.6 LTM Adj. EBITDA(1) $ 85,818 |
|
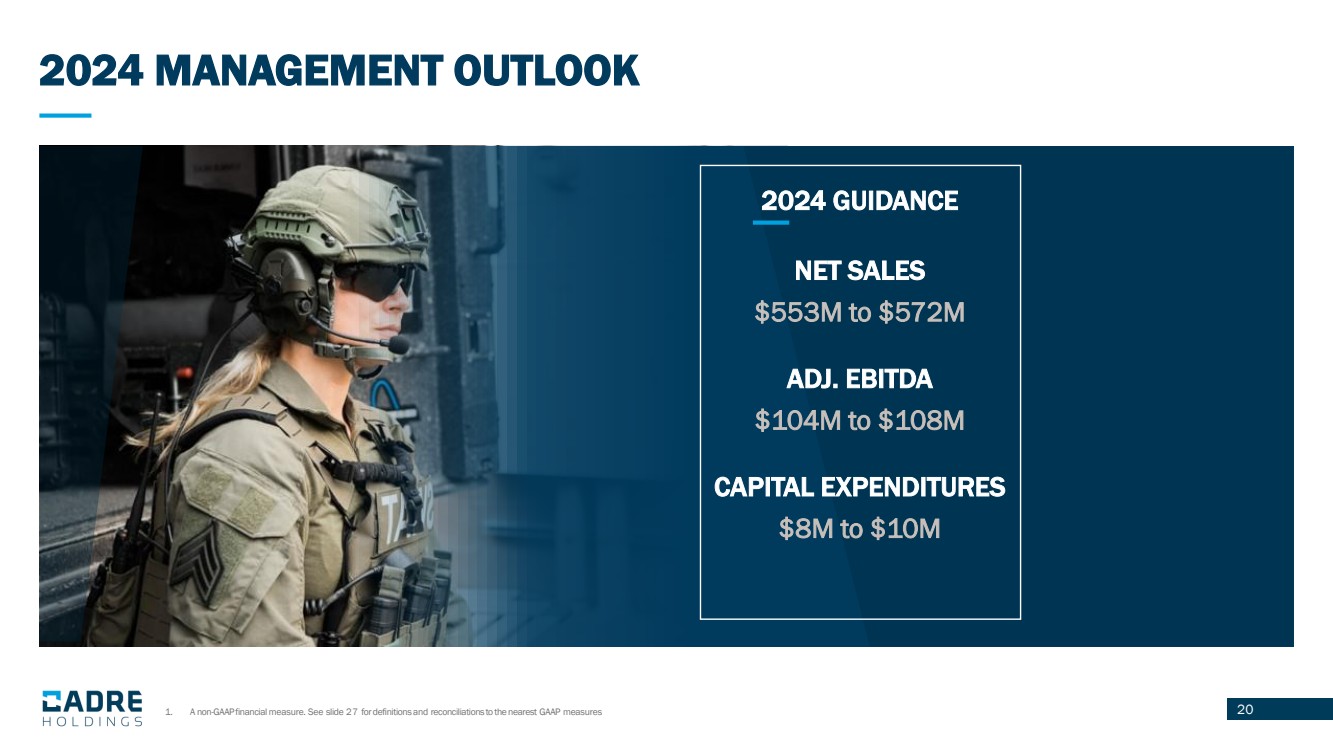
20 2024 MANAGEMENT OUTLOOK 2024 GUIDANCE NET SALES $553M to $572M ADJ. EBITDA $104M to $108M CAPITAL EXPENDITURES $8M to $10M 1. A non-GAAP financial measure. See slide 27 for definitions and reconciliations to the nearest GAAP measures |
|
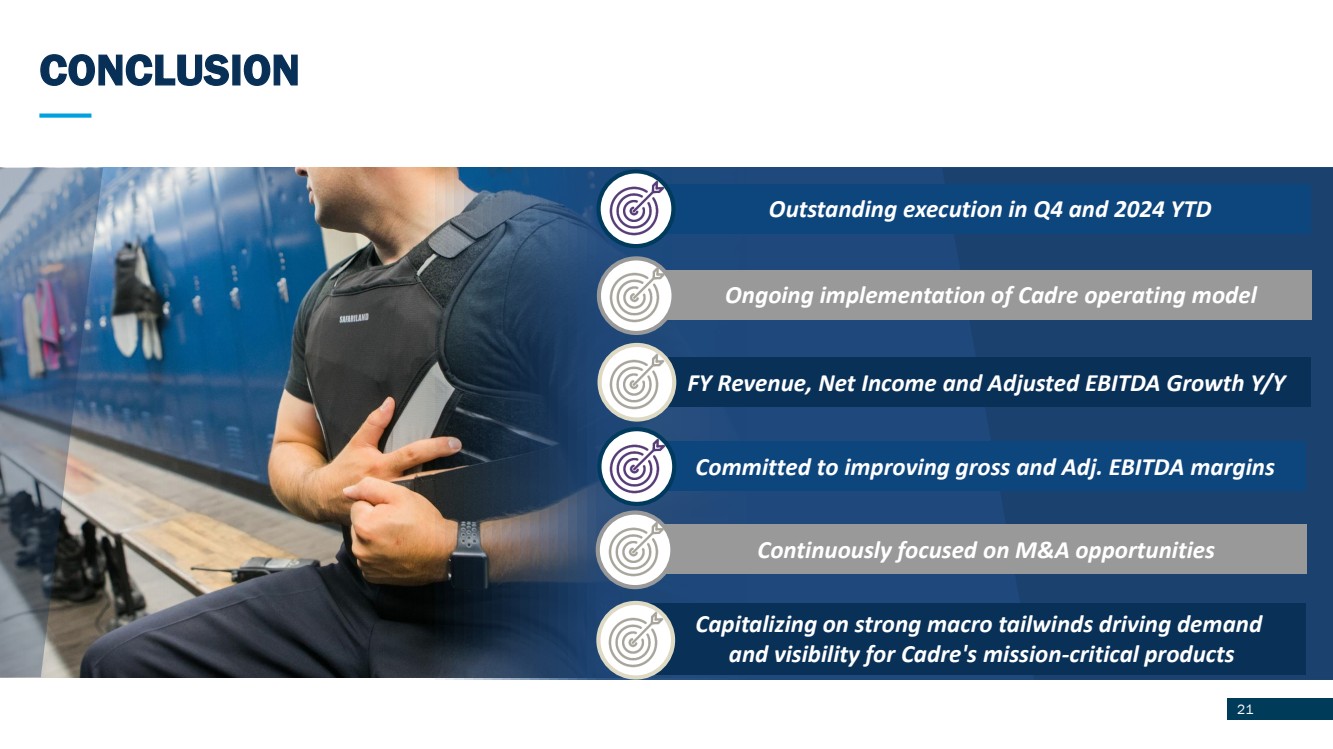
CONCLUSION 21 Outstanding execution in Q4 and 2024 YTD FY Revenue, Net Income and Adjusted EBITDA Growth Y/Y Ongoing implementation of Cadre operating model Committed to improving gross and Adj. EBITDA margins Capitalizing on strong macro tailwinds driving demand and visibility for Cadre's mission-critical products Continuously focused on M&A opportunities |
|
22 APPENDIX |

|
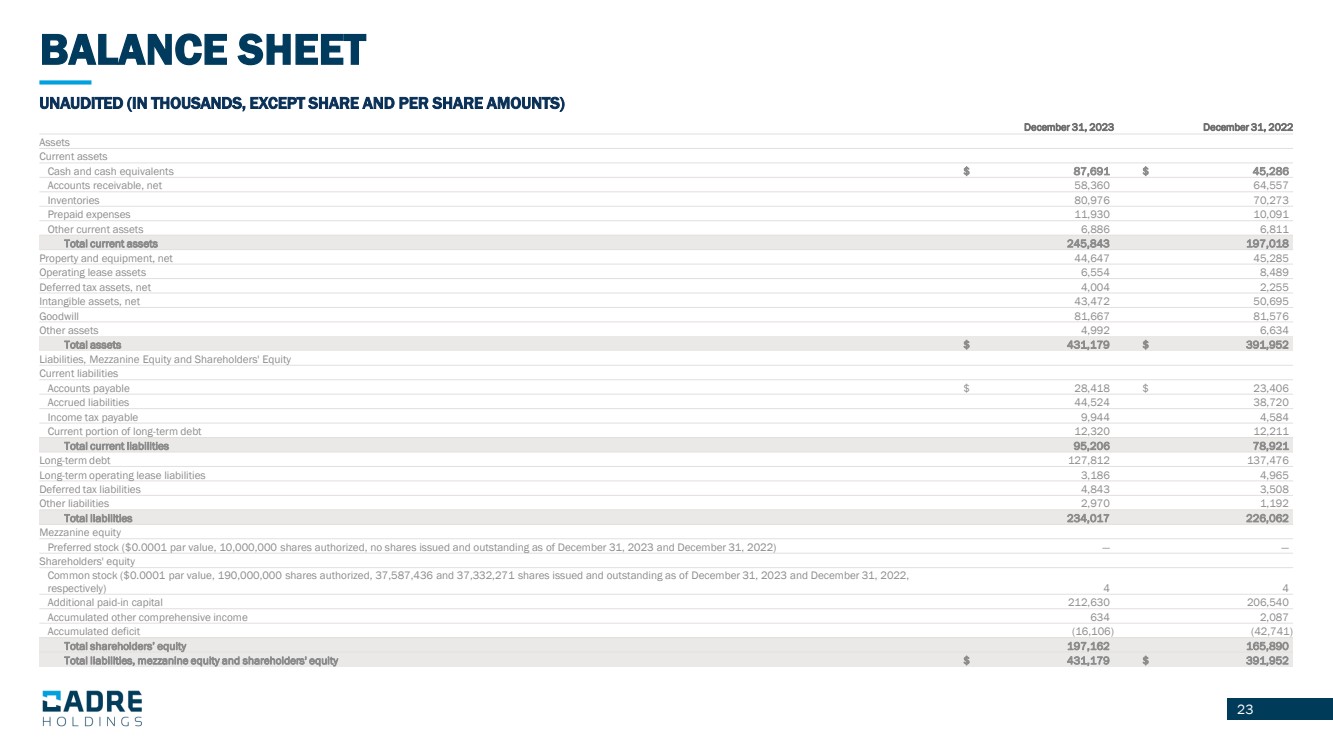
23 BALANCE SHEET UNAUDITED (IN THOUSANDS, EXCEPT SHARE AND PER SHARE AMOUNTS) December 31, 2023 December 31, 2022 Assets Current assets Cash and cash equivalents $ 87,691 $ 45,286 Accounts receivable, net 58,360 64,557 Inventories 80,976 70,273 Prepaid expenses 11,930 10,091 Other current assets 6,886 6,811 Total current assets 245,843 197,018 Property and equipment, net 44,647 45,285 Operating lease assets 6,554 8,489 Deferred tax assets, net 4,004 2,255 Intangible assets, net 43,472 50,695 Goodwill 81,667 81,576 Other assets 4,992 6,634 Total assets $ 431,179 $ 391,952 Liabilities, Mezzanine Equity and Shareholders' Equity Current liabilities Accounts payable $ 28,418 $ 23,406 Accrued liabilities 44,524 38,720 Income tax payable 9,944 4,584 Current portion of long-term debt 12,320 12,211 Total current liabilities 95,206 78,921 Long-term debt 127,812 137,476 Long-term operating lease liabilities 3,186 4,965 Deferred tax liabilities 4,843 3,508 Other liabilities 2,970 1,192 Total liabilities 234,017 226,062 Mezzanine equity Preferred stock ($0.0001 par value, 10,000,000 shares authorized, no shares issued and outstanding as of December 31, 2023 and December 31, 2022) — — Shareholders' equity Common stock ($0.0001 par value, 190,000,000 shares authorized, 37,587,436 and 37,332,271 shares issued and outstanding as of December 31, 2023 and December 31, 2022, respectively) 4 4 Additional paid-in capital 212,630 206,540 Accumulated other comprehensive income 634 2,087 Accumulated deficit (16,106) (42,741) Total shareholders’ equity 197,162 165,890 Total liabilities, mezzanine equity and shareholders' equity $ 431,179 $ 391,952 |
|
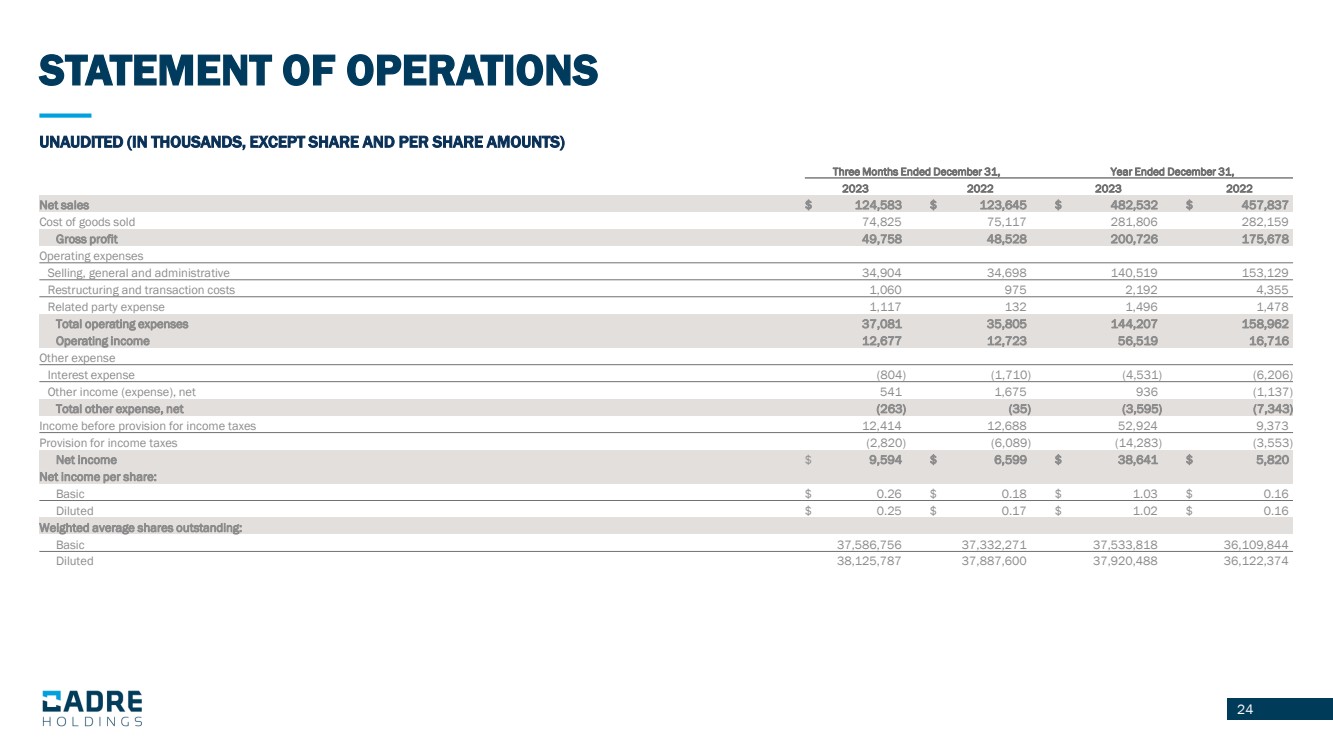
24 STATEMENT OF OPERATIONS UNAUDITED (IN THOUSANDS, EXCEPT SHARE AND PER SHARE AMOUNTS) Three Months Ended December 31, Year Ended December 31, 2023 2022 2023 2022 Net sales $ 124,583 $ 123,645 $ 482,532 $ 457,837 Cost of goods sold 74,825 75,117 281,806 282,159 Gross profit 49,758 48,528 200,726 175,678 Operating expenses Selling, general and administrative 34,904 34,698 140,519 153,129 Restructuring and transaction costs 1,060 975 2,192 4,355 Related party expense 1,117 132 1,496 1,478 Total operating expenses 37,081 35,805 144,207 158,962 Operating income 12,677 12,723 56,519 16,716 Other expense Interest expense (804) (1,710) (4,531) (6,206) Other income (expense), net 541 1,675 936 (1,137) Total other expense, net (263) (35) (3,595) (7,343) Income before provision for income taxes 12,414 12,688 52,924 9,373 Provision for income taxes (2,820) (6,089) (14,283) (3,553) Net income $ 9,594 $ 6,599 $ 38,641 $ 5,820 Net income per share: Basic $ 0.26 $ 0.18 $ 1.03 $ 0.16 Diluted $ 0.25 $ 0.17 $ 1.02 $ 0.16 Weighted average shares outstanding: Basic 37,586,756 37,332,271 37,533,818 36,109,844 Diluted 38,125,787 37,887,600 37,920,488 36,122,374 |
|
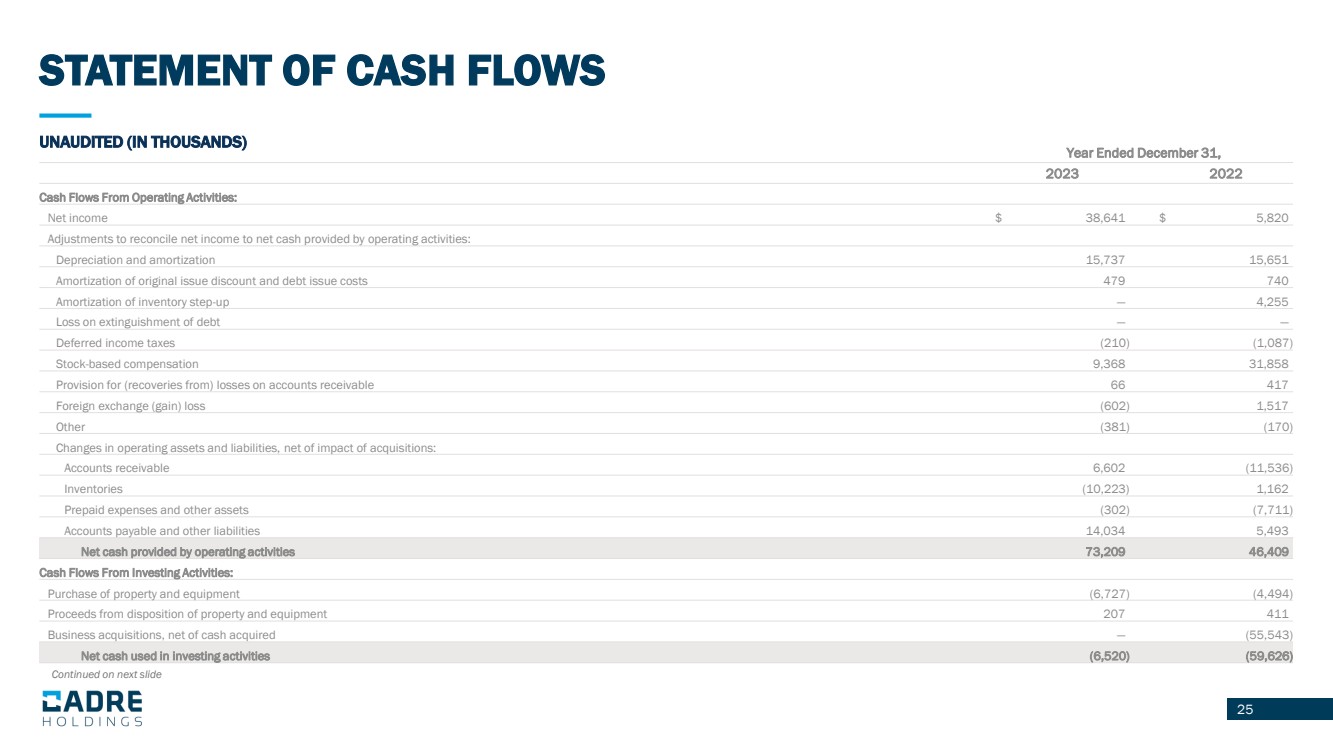
25 STATEMENT OF CASH FLOWS UNAUDITED (IN THOUSANDS) Year Ended December 31, 2023 2022 Cash Flows From Operating Activities: Net income $ 38,641 $ 5,820 Adjustments to reconcile net income to net cash provided by operating activities: Depreciation and amortization 15,737 15,651 Amortization of original issue discount and debt issue costs 479 740 Amortization of inventory step-up — 4,255 Loss on extinguishment of debt — — Deferred income taxes (210) (1,087) Stock-based compensation 9,368 31,858 Provision for (recoveries from) losses on accounts receivable 66 417 Foreign exchange (gain) loss (602) 1,517 Other (381) (170) Changes in operating assets and liabilities, net of impact of acquisitions: Accounts receivable 6,602 (11,536) Inventories (10,223) 1,162 Prepaid expenses and other assets (302) (7,711) Accounts payable and other liabilities 14,034 5,493 Net cash provided by operating activities 73,209 46,409 Cash Flows From Investing Activities: Purchase of property and equipment (6,727) (4,494) Proceeds from disposition of property and equipment 207 411 Business acquisitions, net of cash acquired — (55,543) Net cash used in investing activities (6,520) (59,626) Continued on next slide |
|
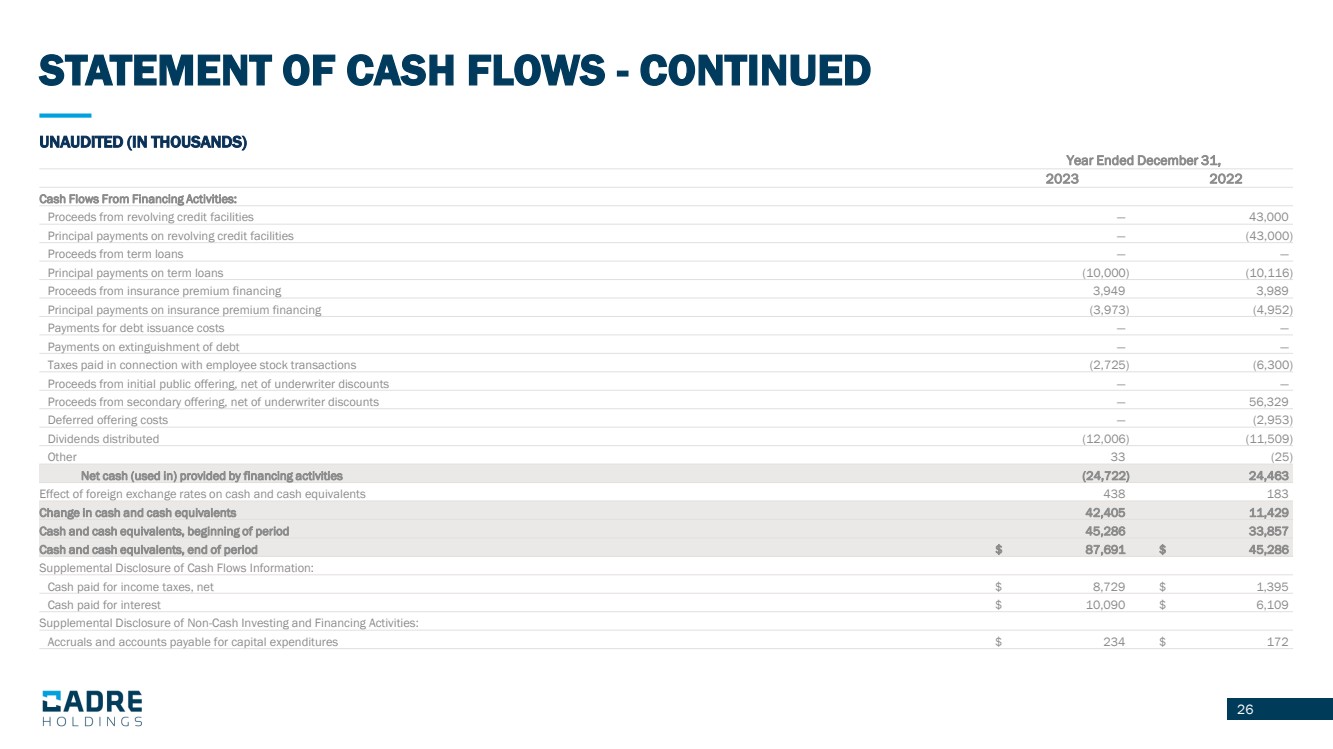
26 STATEMENT OF CASH FLOWS - CONTINUED UNAUDITED (IN THOUSANDS) Year Ended December 31, 2023 2022 Cash Flows From Financing Activities: Proceeds from revolving credit facilities — 43,000 Principal payments on revolving credit facilities — (43,000) Proceeds from term loans — — Principal payments on term loans (10,000) (10,116) Proceeds from insurance premium financing 3,949 3,989 Principal payments on insurance premium financing (3,973) (4,952) Payments for debt issuance costs — — Payments on extinguishment of debt — — Taxes paid in connection with employee stock transactions (2,725) (6,300) Proceeds from initial public offering, net of underwriter discounts — — Proceeds from secondary offering, net of underwriter discounts — 56,329 Deferred offering costs — (2,953) Dividends distributed (12,006) (11,509) Other 33 (25) Net cash (used in) provided by financing activities (24,722) 24,463 Effect of foreign exchange rates on cash and cash equivalents 438 183 Change in cash and cash equivalents 42,405 11,429 Cash and cash equivalents, beginning of period 45,286 33,857 Cash and cash equivalents, end of period $ 87,691 $ 45,286 Supplemental Disclosure of Cash Flows Information: Cash paid for income taxes, net $ 8,729 $ 1,395 Cash paid for interest $ 10,090 $ 6,109 Supplemental Disclosure of Non-Cash Investing and Financing Activities: Accruals and accounts payable for capital expenditures $ 234 $ 172 |
|
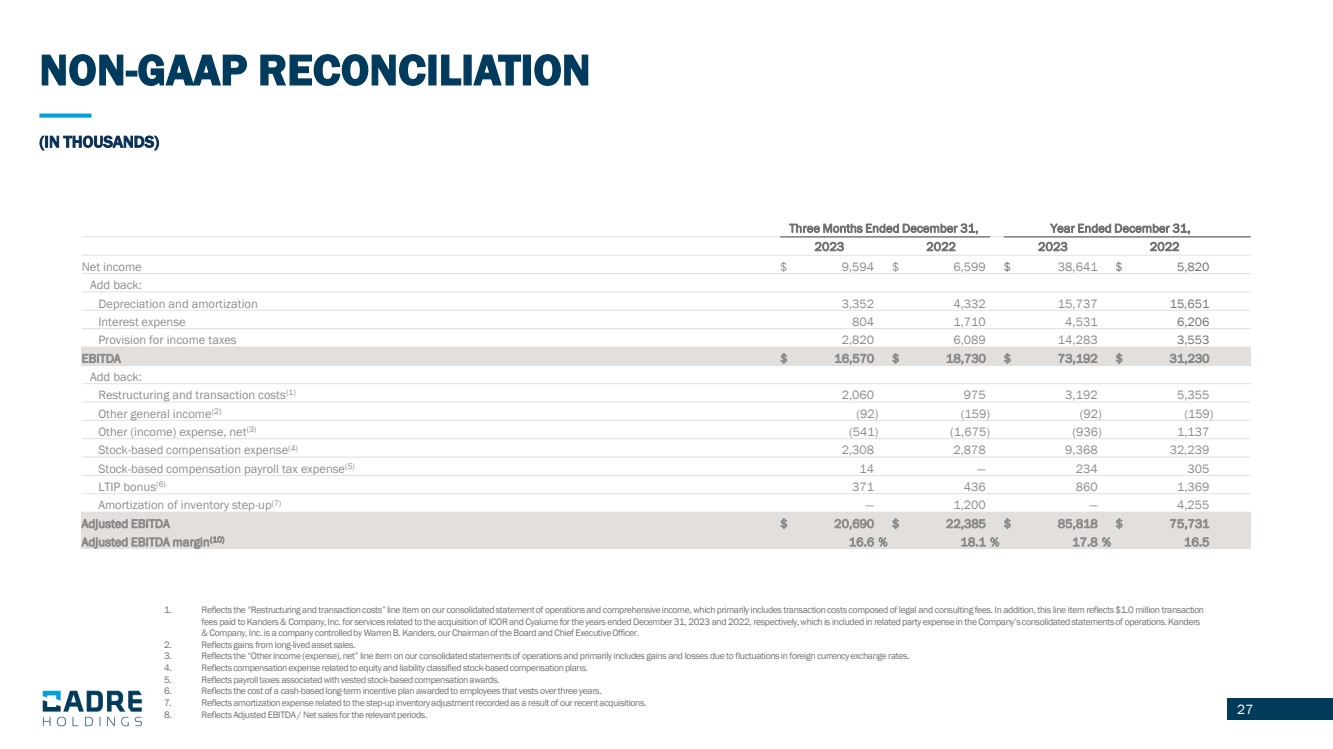
27 1. Reflects the “Restructuring and transaction costs” line item on our consolidated statement of operations and comprehensive income, which primarily includes transaction costs composed of legal and consulting fees. In addition, this line item reflects $1.0 million transaction fees paid to Kanders& Company, Inc. for services related to the acquisition of ICOR and Cyalume for the years ended December 31, 2023 and 2022, respectively, which is included in related party expense in the Company’s consolidated statements of operations. Kanders & Company, Inc. is a company controlled by Warren B. Kanders, our Chairman of the Board and Chief Executive Officer. 2. Reflects gains from long-lived asset sales. 3. Reflects the “Other income (expense), net” line item on our consolidated statements of operations and primarily includes gains and losses due to fluctuations in foreign currency exchange rates. 4. Reflects compensation expense related to equity and liability classified stock-based compensation plans. 5. Reflects payroll taxes associated with vested stock-based compensation awards. 6. Reflects the cost of a cash-based long-term incentive plan awarded to employees that vests over three years. 7. Reflects amortization expense related to the step-up inventory adjustment recorded as a result of our recent acquisitions. 8. Reflects Adjusted EBITDA / Net sales for the relevant periods. 27 (IN THOUSANDS) NON-GAAP RECONCILIATION Three Months Ended December 31, Year Ended December 31, 2023 2022 2023 2022 Net income $ 9,594 $ 6,599 $ 38,641 $ 5,820 Add back: Depreciation and amortization 3,352 4,332 15,737 15,651 Interest expense 804 1,710 4,531 6,206 Provision for income taxes 2,820 6,089 14,283 3,553 EBITDA $ 16,570 $ 18,730 $ 73,192 $ 31,230 Add back: Restructuring and transaction costs(1) 2,060 975 3,192 5,355 Other general income(2) (92) (159) (92) (159) Other (income) expense, net(3) (541) (1,675) (936) 1,137 Stock-based compensation expense(4) 2,308 2,878 9,368 32,239 Stock-based compensation payroll tax expense(5) 14 — 234 305 LTIP bonus(6) 371 436 860 1,369 Amortization of inventory step-up(7) — 1,200 — 4,255 Adjusted EBITDA $ 20,690 $ 22,385 $ 85,818 $ 75,731 Adjusted EBITDA margin(10) 16.6 % 18.1 % 17.8 % 16.5 |
|
28 USE OF NON-GAAP MEASURES The Company reports its financial results in accordance with U.S. generally accepted accounting principles (“GAAP”). The press release contains the non-GAAP measures: (i) earnings before interest, taxes, other income or expense, depreciation and amortization (“EBITDA”), (ii) adjusted EBITDA and (iii) adjusted EBITDA margin. The Company believes the presentation of these non-GAAP measures provides useful information for the understanding of its ongoing operations and enables investors to focus on period- over-period operating performance, and thereby enhances the user’s overall understanding of the Company’s current financial performance relative to past performance and provides, along with the nearest GAAP measures, a baseline for modeling future earnings expectations. Non-GAAP measures are reconciled to comparable GAAP financial measures within this press release. The Company cautions that non-GAAP measures should be considered in addition to, but not as a substitute for, the Company’s reported GAAP results. Additionally, the Company notes that there can be no assurance that the above referenced non-GAAP financial measures are comparable to similarly titled financial measures used by other publicly traded companies. 2 |