EX-99.2
Published on March 10, 2022
Exhibit 99.2
|
FOURTH QUARTER 2021 |

|
2 FORWARD - LOOKING STATEMENTS Except for historical information, certain matters discussed in this presentation may be forward - looking statements within the meaning of the Private Securities Litigation Reform Act of 1995. Forward - looking statements include but are not limited to all projections and anticipated levels of future performance. Forward - looking statements involve risks, uncertainties and other factors that may cause our actual results to differ materially from those discussed herein. Any number of factors could cause actual results to differ materially from projections or forward - looking statements, including without limitation global economic conditions, spending patterns of government agencies, competitive pressures, the impact of acquisitions and related integration activities, product liability claims, the success of new product introductions, currency exchange rate fluctuations and the risks of doing business in in the markets in which we operate, including foreign countries. More information on potential factors that could affect the Company’s financial results are more fully described from time to time in the Company’s public reports filed with the Securities and Exchange Commission, including the Company’s Annual Report on Form 10 - K, Quarterly Reports on Form 10 - Q, and Current Reports on Form 8 - K. All forward - looking statements included in this presentation are based upon information available to the Company as of the date of this presentation, and speak only as of the date hereof. We assume no obligation to update any forward - looking statements to reflect events or circumstances after the date of this presentation .. 2 |
|
TODAY’S PRESENTERS 3 BRAD WILLIAMS President BLAINE BROWERS Chief Financial Officer WARREN KANDERS Chief Executive Officer and Chairman of the Board |

|
4 AGENDA • Q4 and FY21 Highlights • Business Overview • Financial Summary • 2022 Outlook • Conclusion and Q&A |
|
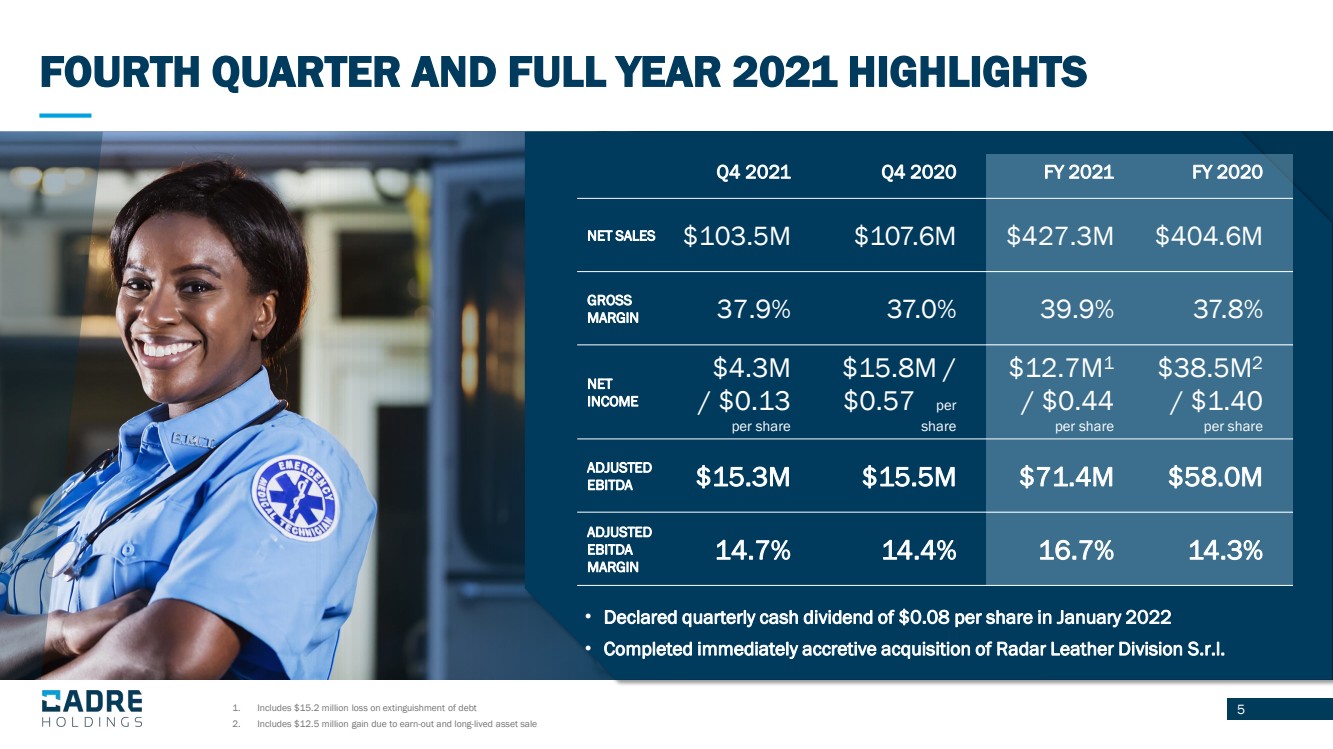
1. Includes $15.2 million loss on extinguishment of debt 2. Includes $12.5 million gain due to earn - out and long - lived asset sale FOURTH QUARTER AND FULL YEAR 2021 HIGHLIGHTS 5 Q4 2021 Q4 2020 FY 2021 FY 2020 NET SALES $103.5M $107.6M $427.3M $404.6M GROSS MARGIN 37.9% 37.0% 39.9% 37.8% NET INCOME $4.3M / $0.13 per share $15.8M / $0.57 per share $12.7M 1 / $0.44 per share $38.5M 2 / $1.40 per share ADJUSTED EBITDA $15.3M $15.5M $71.4M $58.0M ADJUSTED EBITDA MARGIN 14.7% 14.4% 16.7% 14.3% • Declared quarterly cash dividend of $0.08 per share in January 2022 • Completed immediately accretive acquisition of Radar Leather Division S.r.l .. |
|
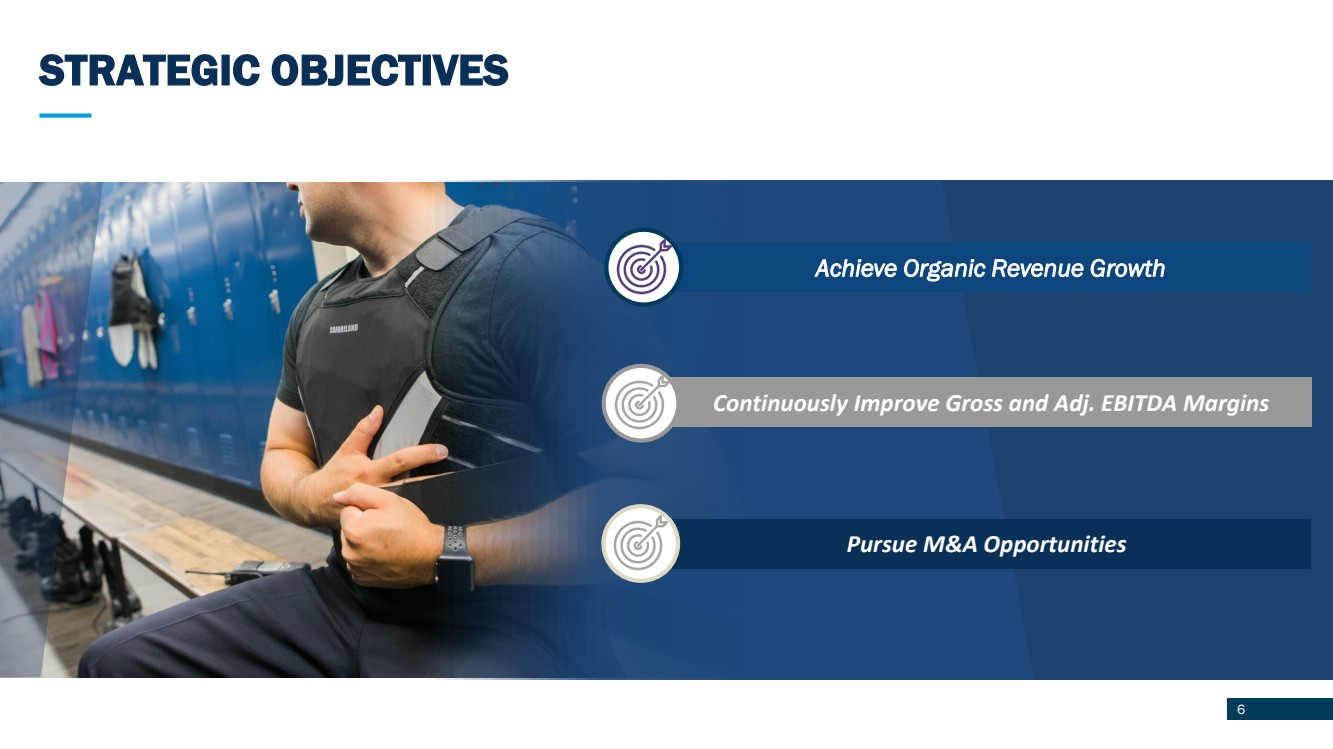
STRATEGIC OBJECTIVES 6 Achieve Organic Revenue Growth Pursue M&A Opportunities Continuously Improve Gross and Adj. EBITDA Margins |
|
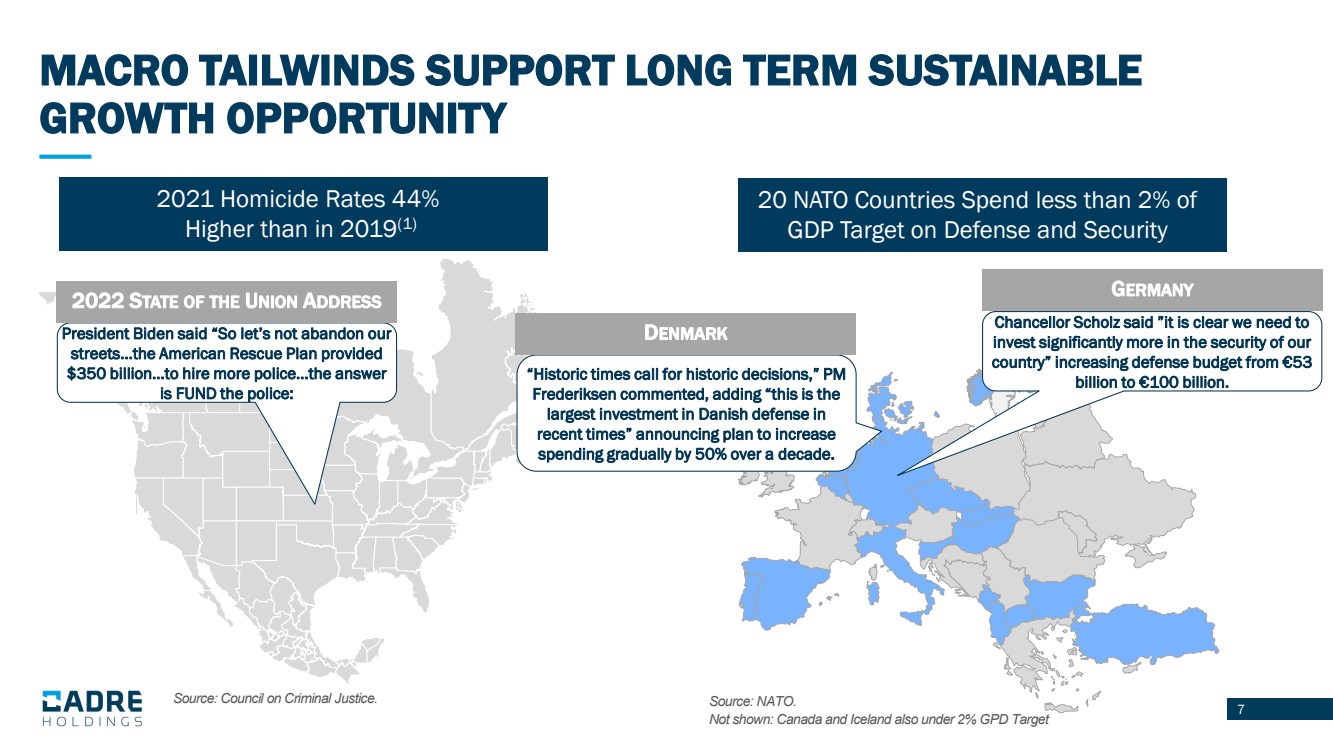
7 MACRO TAILWINDS SUPPORT LONG TERM SUSTAINABLE GROWTH OPPORTUNITY Source: NATO. Not shown: Canada and Iceland also under 2% GPD Target 20 NATO Countries Spend less than 2% of GDP Target on Defense and Security Chancellor Scholz said ”it is clear we need to invest significantly more in the security of our country” increasing defense budget from €53 billion to €100 billion. G ERMANY 2021 Homicide Rates 44% Higher than in 2019 (1) President Biden said “So let’s not abandon our streets…the American Rescue Plan provided $350 billion…to hire more police…the answer is FUND the police: 2022 S TATE OF THE U NION A DDRESS Source: Council on Criminal Justice. “Historic times call for historic decisions,” PM Frederiksen commented, adding “this is the largest investment in Danish defense in recent times” announcing plan to increase spending gradually by 50% over a decade. D ENMARK |
|
8 20 20 13 CADRE'S KEY M&A CRITERIA Niche market No large - cap competition Leading market share Cost structure where material > labor Leading and defensible technology High cost of substitution Mission - critical to customer Recurring revenue profile Asset - light Business Financial Market Strong brand recognition Attractive ROIC Resiliency through market cycles CADRE'S KEY M&A CRITERIA 8 |

|
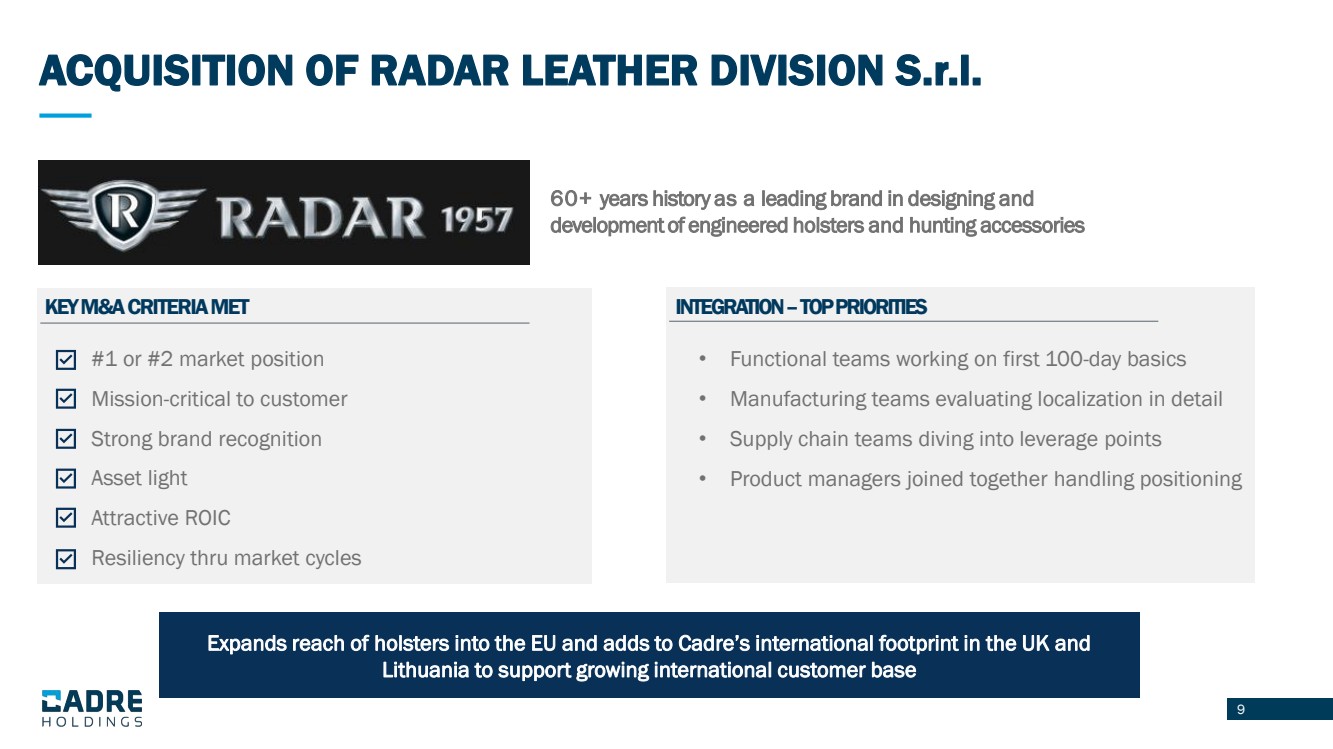
9 21 21 60+ years history as a leading brand in designing and development of engineered holsters and hunting accessories KEY M&A CRITERIA MET ACQUISITION OF RADAR LEATHER DIVISION S.r.l .. #1 or #2 market position Mission - critical to customer Strong brand recognition Asset light Attractive ROIC Resiliency thru market cycles INTEGRATION – TOP PRIORITIES • Functional teams working on first 100 - day basics • Manufacturing teams evaluating localization in detail • Supply chain teams diving into leverage points • Product managers joined together handling positioning Expands reach of holsters into the EU and adds to Cadre’s international footprint in the UK and Lithuania to support growing international customer base 9 |
|
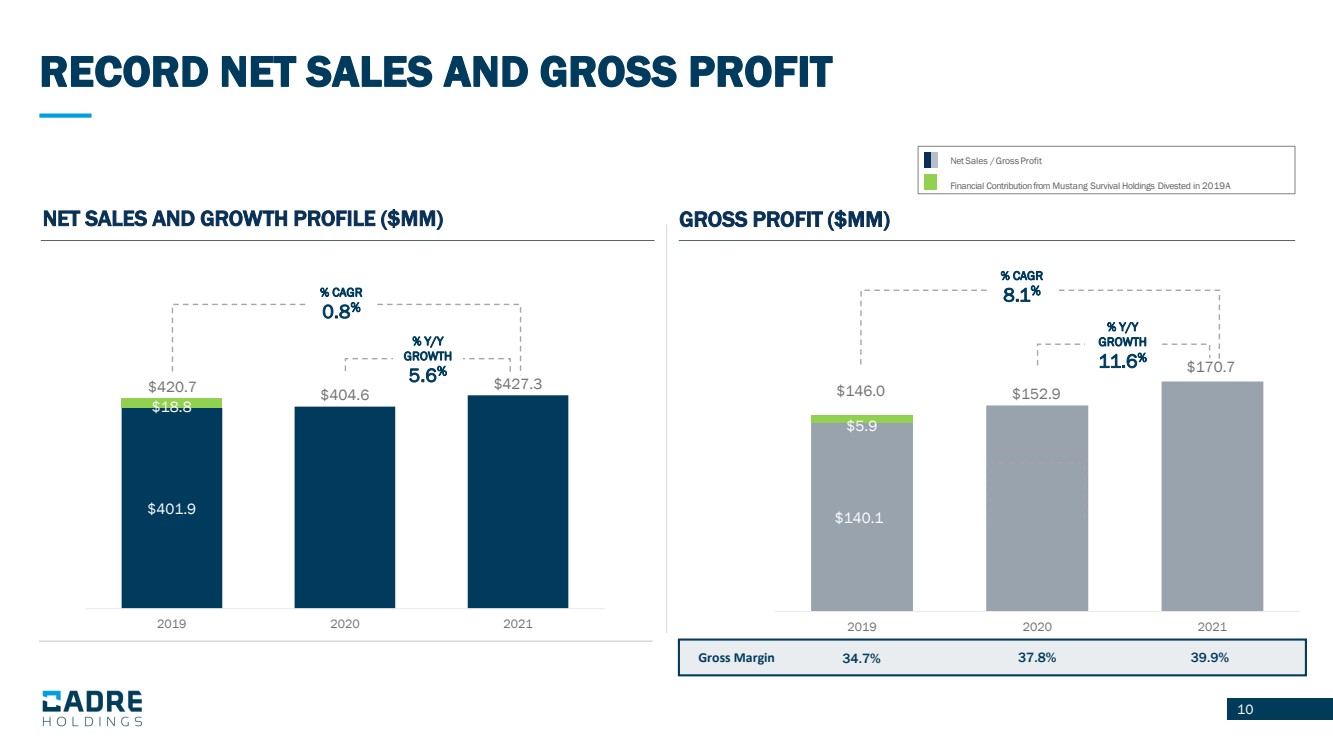
10 $140.1 $152.9 $170.7 $5.9 2019 2020 2021 RECORD NET SALES AND GROSS PROFIT NET SALES AND GROWTH PROFILE ($MM) GROSS PROFIT ($MM) $401.9 $404.6 $427.3 $18.8 2019 2020 2021 $420.7 Gross Margin 34.7% 37.8% 39.9% $146.0 Net Sales / Gross Profit Financial Contribution from Mustang Survival Holdings Divested in 2019A % CAGR 0.8 % % Y/Y GROWTH 5.6 % % CAGR 8.1 % % Y/Y GROWTH 11.6 % |
|
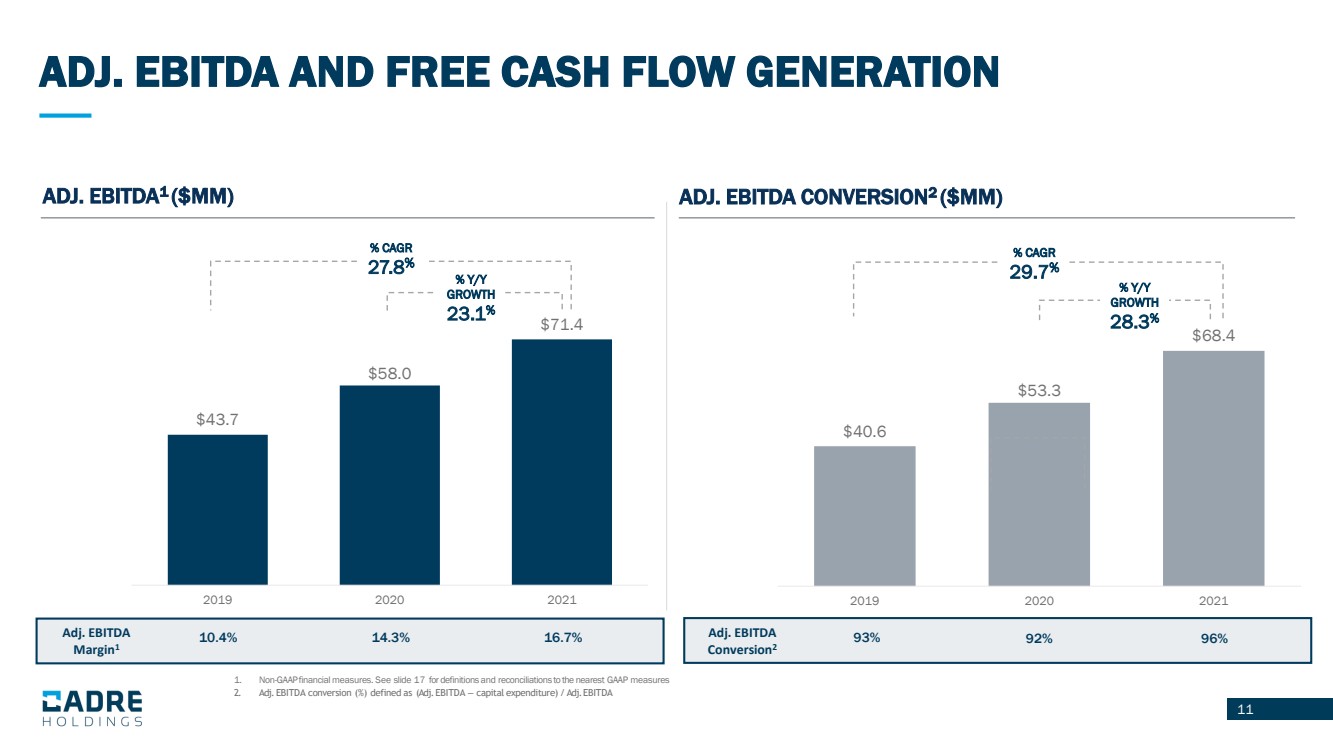
11 1. Non - GAAP financial measures. See slide 17 for definitions and reconciliations to the nearest GAAP measures 2. Adj. EBITDA conversion (%) defined as (Adj. EBITDA – capital expenditure) / Adj. EBITDA ADJ. EBITDA AND FREE CASH FLOW GENERATION $40.6 $53.3 $68.4 2019 2020 2021 ADJ. EBITDA 1 ($MM) ADJ. EBITDA CONVERSION 2 ($MM) $43.7 $58.0 $71.4 2019 2020 2021 Adj. EBITDA Margin 1 10.4% 14.3% 16.7% Adj. EBITDA Conversion 2 93% 92% 96% % CAGR 27.8 % % Y/Y GROWTH 23.1 % % CAGR 29.7 % % Y/Y GROWTH 28.3 % |
|
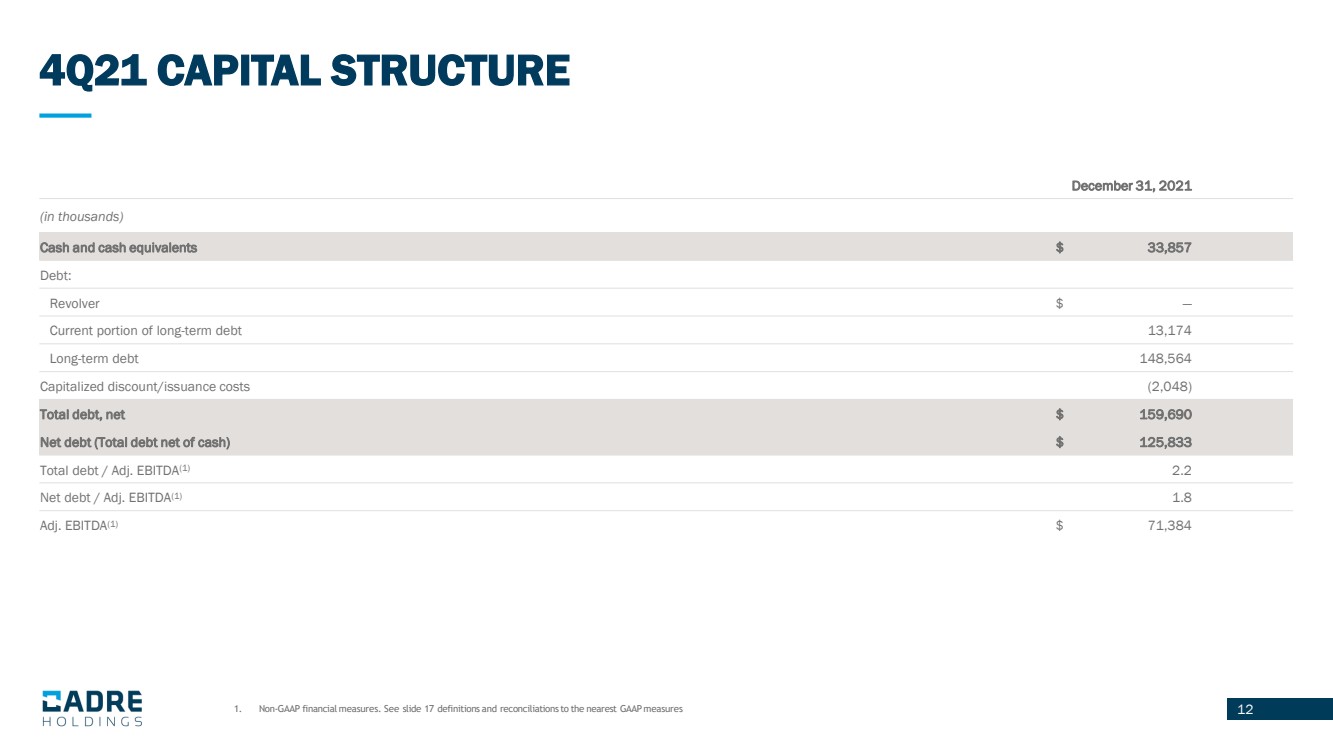
12 4Q21 CAPITAL STRUCTURE 1. Non - GAAP financial measures. See slide 17 definitions and reconciliations to the nearest GAAP measures December 31, 2021 (in thousands) Cash and cash equivalents $ 33,857 Debt: Revolver $ — Current portion of long - term debt 13,174 Long - term debt 148,564 Capitalized discount/issuance costs (2,048) Total debt, net $ 159,690 Net debt (Total debt net of cash) $ 125,833 Total debt / Adj. EBITDA (1) 2.2 Net debt / Adj. EBITDA (1) 1.8 Adj. EBITDA (1) $ 71,384 |
|
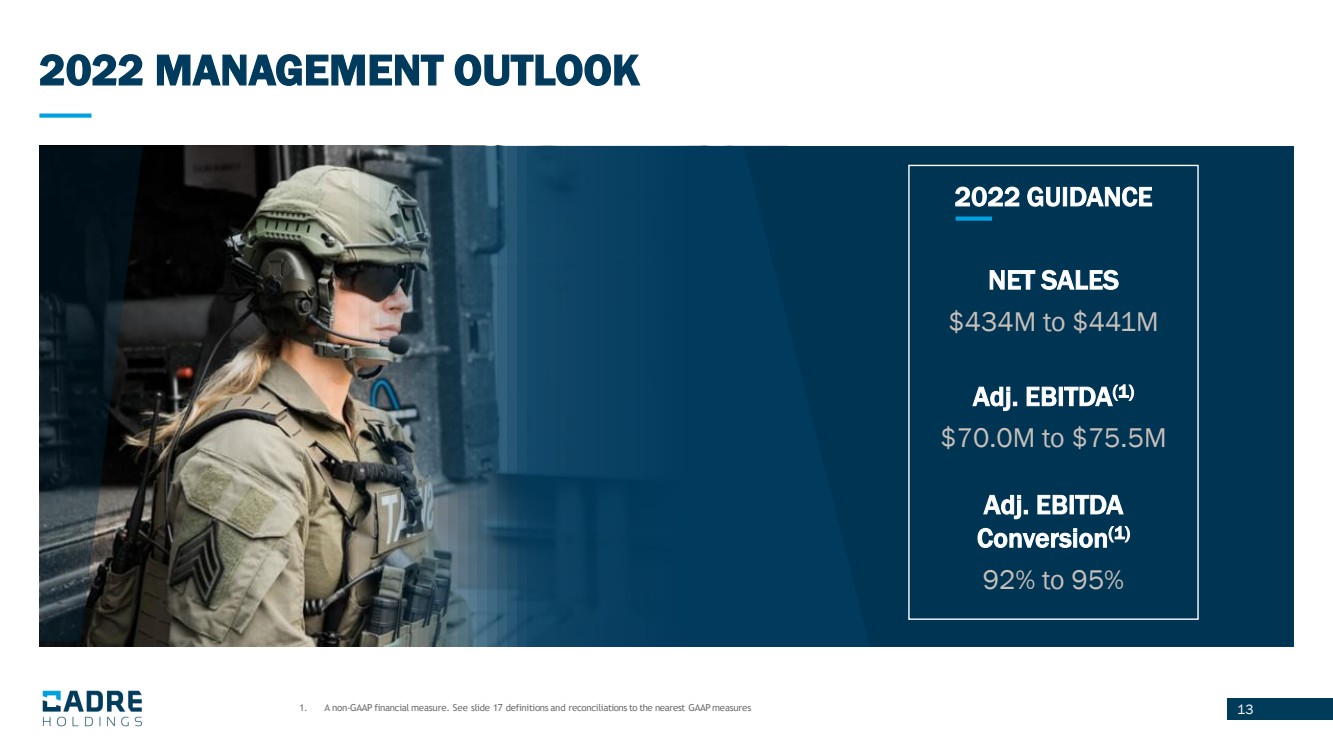
13 2022 MANAGEMENT OUTLOOK 2022 GUIDANCE NET SALES $434M to $441M Adj. EBITDA (1) $70.0M to $75.5M Adj. EBITDA Conversion (1) 92% to 95% 1. A non - GAAP financial measure. See slide 17 definitions and reconciliations to the nearest GAAP measures |
|
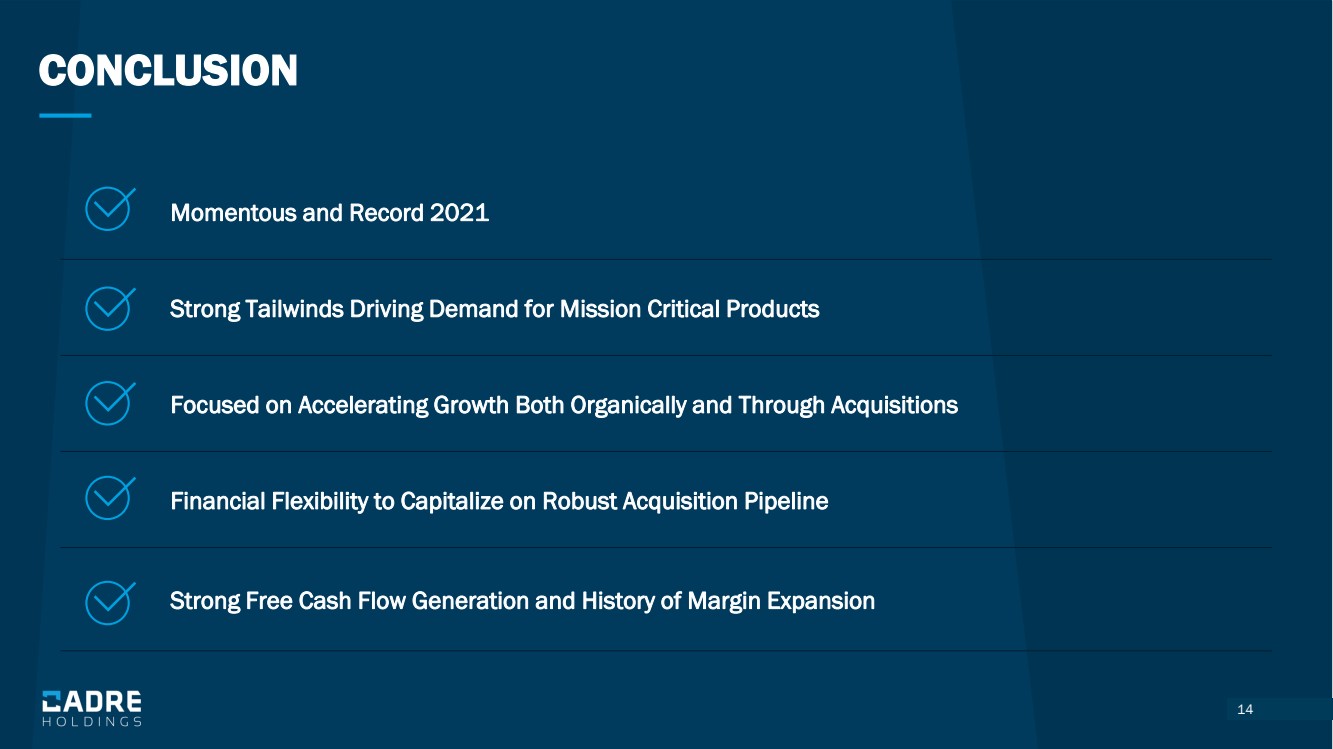
14 CONCLUSION 14 Momentous and Record 2021 Strong Tailwinds Driving Demand for Mission Critical Products Focused on Accelerating Growth Both Organically and Through Acquisitions Financial Flexibility to Capitalize on Robust Acquisition Pipeline Strong Free Cash Flow Generation and History of Margin Expansion |
|
15 APPENDIX |

|
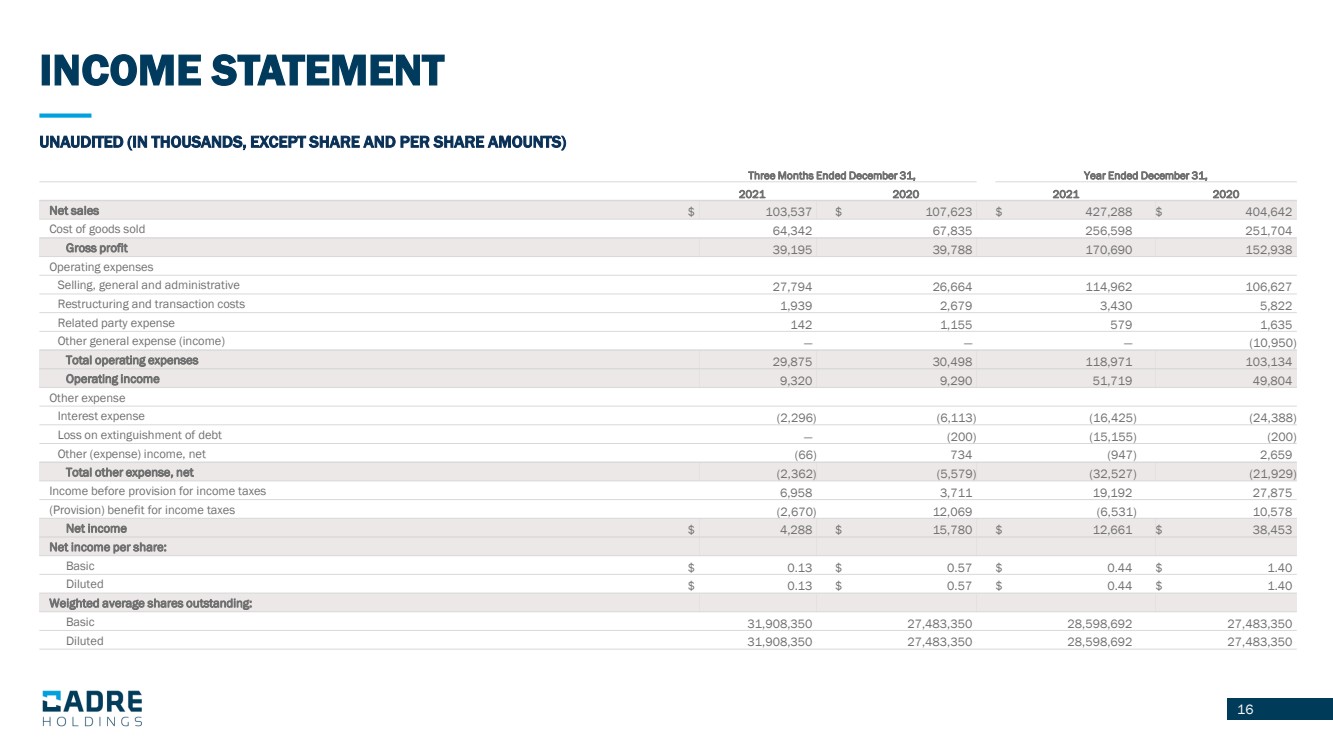
16 INCOME STATEMENT 16 UNAUDITED (IN THOUSANDS, EXCEPT SHARE AND PER SHARE AMOUNTS) Three Months Ended December 31, Year Ended December 31, 2021 2020 2021 2020 Net sales $ 103,537 $ 107,623 $ 427,288 $ 404,642 Cost of goods sold 64,342 67,835 256,598 251,704 Gross profit 39,195 39,788 170,690 152,938 Operating expenses Selling, general and administrative 27,794 26,664 114,962 106,627 Restructuring and transaction costs 1,939 2,679 3,430 5,822 Related party expense 142 1,155 579 1,635 Other general expense (income) — — — (10,950) Total operating expenses 29,875 30,498 118,971 103,134 Operating income 9,320 9,290 51,719 49,804 Other expense Interest expense (2,296) (6,113) (16,425) (24,388) Loss on extinguishment of debt — (200) (15,155) (200) Other (expense) income, net (66) 734 (947) 2,659 Total other expense, net (2,362) (5,579) (32,527) (21,929) Income before provision for income taxes 6,958 3,711 19,192 27,875 (Provision) benefit for income taxes (2,670) 12,069 (6,531) 10,578 Net income $ 4,288 $ 15,780 $ 12,661 $ 38,453 Net income per share: Basic $ 0.13 $ 0.57 $ 0.44 $ 1.40 Diluted $ 0.13 $ 0.57 $ 0.44 $ 1.40 Weighted average shares outstanding: Basic 31,908,350 27,483,350 28,598,692 27,483,350 Diluted 31,908,350 27,483,350 28,598,692 27,483,350 |
|
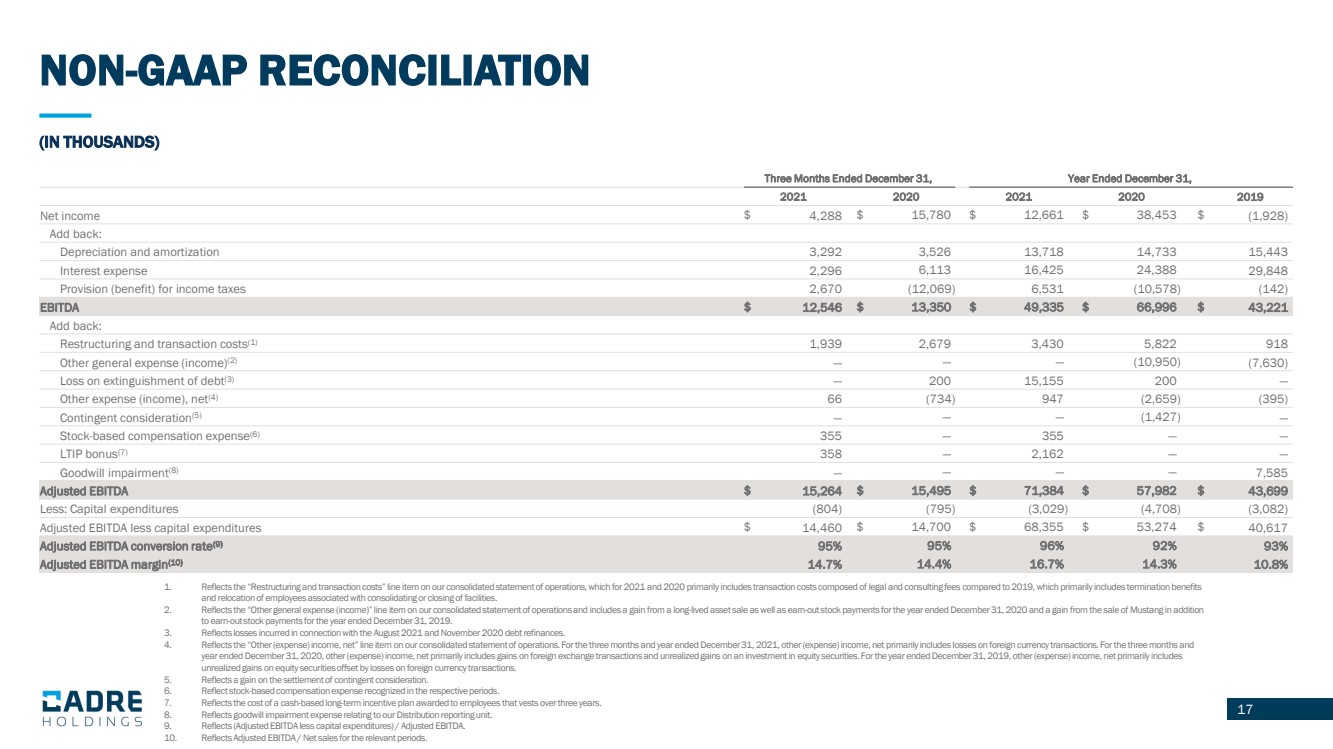
17 1. Reflects the “Restructuring and transaction costs” line item on our consolidated statement of operations, which for 2021 and 202 0 primarily includes transaction costs composed of legal and consulting fees compared to 2019, which primarily includes termi nat ion benefits and relocation of employees associated with consolidating or closing of facilities. 2. Reflects the “Other general expense (income)” line item on our consolidated statement of operations and includes a gain from a l ong - lived asset sale as well as earn - out stock payments for the year ended December 31, 2020 and a gain from the sale of Mustang in addition to earn - out stock payments for the year ended December 31, 2019. 3. Reflects losses incurred in connection with the August 2021 and November 2020 debt refinances. 4. Reflects the “Other (expense) income, net” line item on our consolidated statement of operations. For the three months and ye ar ended December 31, 2021, other (expense) income, net primarily includes losses on foreign currency transactions. For the thre e m onths and year ended December 31, 2020, other (expense) income, net primarily includes gains on foreign exchange transactions and unrea liz ed gains on an investment in equity securities. For the year ended December 31, 2019, other (expense) income, net primarily i ncl udes unrealized gains on equity securities offset by losses on foreign currency transactions. 5. Reflects a gain on the settlement of contingent consideration. 6. Reflect stock - based compensation expense recognized in the respective periods. 7. Reflects the cost of a cash - based long - term incentive plan awarded to employees that vests over three years. 8. Reflects goodwill impairment expense relating to our Distribution reporting unit. 9. Reflects (Adjusted EBITDA less capital expenditures) / Adjusted EBITDA. 10. Reflects Adjusted EBITDA / Net sales for the relevant periods. 17 (IN THOUSANDS) NON - GAAP RECONCILIATION Three Months Ended December 31, Year Ended December 31, 2021 2020 2021 2020 2019 Net income $ 4,288 $ 15,780 $ 12,661 $ 38,453 $ (1,928) Add back: Depreciation and amortization 3,292 3,526 13,718 14,733 15,443 Interest expense 2,296 6,113 16,425 24,388 29,848 Provision (benefit) for income taxes 2,670 (12,069) 6,531 (10,578) (142) EBITDA $ 12,546 $ 13,350 $ 49,335 $ 66,996 $ 43,221 Add back: Restructuring and transaction costs (1) 1,939 2,679 3,430 5,822 918 Other general expense (income) (2) — — — (10,950) (7,630) Loss on extinguishment of debt (3) — 200 15,155 200 — Other expense (income), net (4) 66 (734) 947 (2,659) (395) Contingent consideration (5) — — — (1,427) — Stock - based compensation expense (6) 355 — 355 — — LTIP bonus (7) 358 — 2,162 — — Goodwill impairment (8) — — — — 7,585 Adjusted EBITDA $ 15,264 $ 15,495 $ 71,384 $ 57,982 $ 43,699 Less: Capital expenditures (804) (795) (3,029) (4,708) (3,082) Adjusted EBITDA less capital expenditures $ 14,460 $ 14,700 $ 68,355 $ 53,274 $ 40,617 Adjusted EBITDA conversion rate (9) 95% 95% 96% 92% 93% Adjusted EBITDA margin (10) 14.7% 14.4% 16.7% 14.3% 10.8% |
|
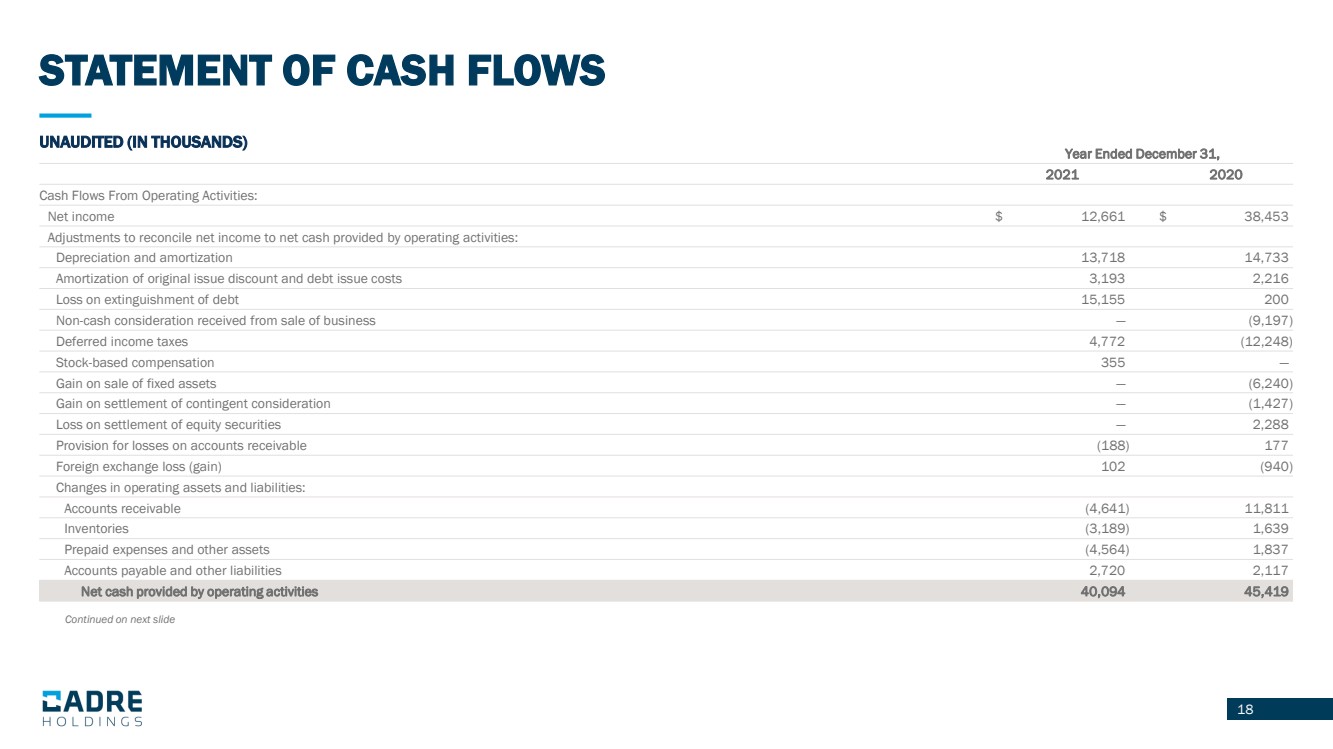
18 STATEMENT OF CASH FLOWS 18 UNAUDITED (IN THOUSANDS) Year Ended December 31, 2021 2020 Cash Flows From Operating Activities: Net income $ 12,661 $ 38,453 Adjustments to reconcile net income to net cash provided by operating activities: Depreciation and amortization 13,718 14,733 Amortization of original issue discount and debt issue costs 3,193 2,216 Loss on extinguishment of debt 15,155 200 Non - cash consideration received from sale of business — (9,197) Deferred income taxes 4,772 (12,248) Stock - based compensation 355 — Gain on sale of fixed assets — (6,240) Gain on settlement of contingent consideration — (1,427) Loss on settlement of equity securities — 2,288 Provision for losses on accounts receivable (188) 177 Foreign exchange loss (gain) 102 (940) Changes in operating assets and liabilities: Accounts receivable (4,641) 11,811 Inventories (3,189) 1,639 Prepaid expenses and other assets (4,564) 1,837 Accounts payable and other liabilities 2,720 2,117 Net cash provided by operating activities 40,094 45,419 Continued on next slide |
|
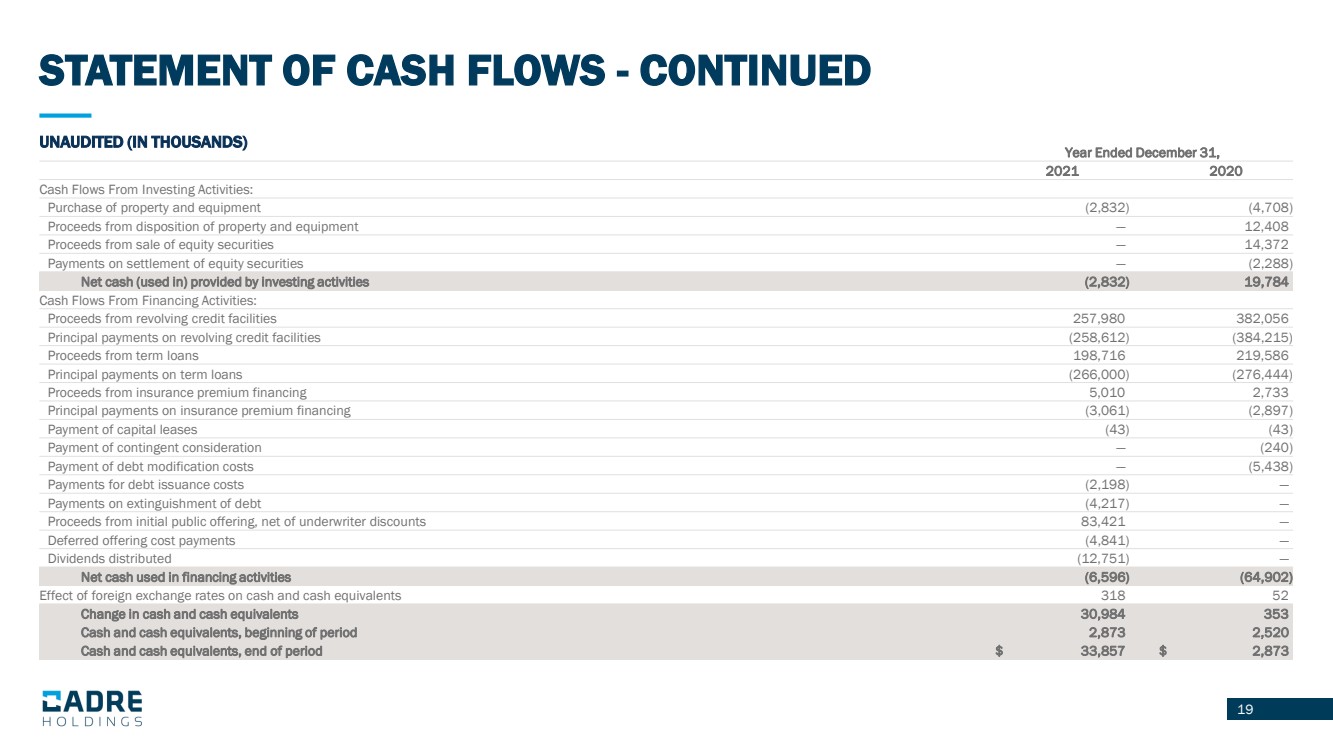
19 STATEMENT OF CASH FLOWS - CONTINUED 19 UNAUDITED (IN THOUSANDS) Year Ended December 31, 2021 2020 Cash Flows From Investing Activities: Purchase of property and equipment (2,832) (4,708) Proceeds from disposition of property and equipment — 12,408 Proceeds from sale of equity securities — 14,372 Payments on settlement of equity securities — (2,288) Net cash (used in) provided by investing activities (2,832) 19,784 Cash Flows From Financing Activities: Proceeds from revolving credit facilities 257,980 382,056 Principal payments on revolving credit facilities (258,612) (384,215) Proceeds from term loans 198,716 219,586 Principal payments on term loans (266,000) (276,444) Proceeds from insurance premium financing 5,010 2,733 Principal payments on insurance premium financing (3,061) (2,897) Payment of capital leases (43) (43) Payment of contingent consideration — (240) Payment of debt modification costs — (5,438) Payments for debt issuance costs (2,198) — Payments on extinguishment of debt (4,217) — Proceeds from initial public offering, net of underwriter discounts 83,421 — Deferred offering cost payments (4,841) — Dividends distributed (12,751) — Net cash used in financing activities (6,596) (64,902) Effect of foreign exchange rates on cash and cash equivalents 318 52 Change in cash and cash equivalents 30,984 353 Cash and cash equivalents, beginning of period 2,873 2,520 Cash and cash equivalents, end of period $ 33,857 $ 2,873 |
|
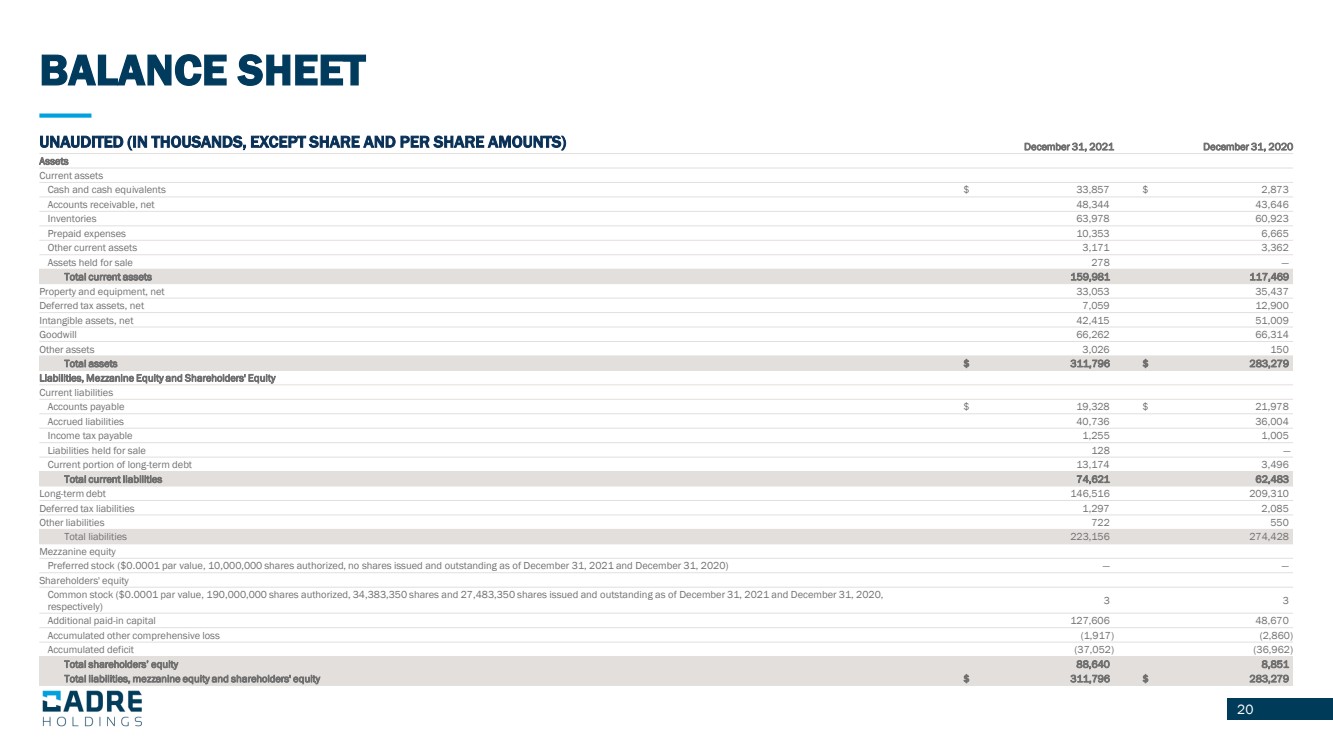
20 BALANCE SHEET 20 UNAUDITED (IN THOUSANDS, EXCEPT SHARE AND PER SHARE AMOUNTS) December 31, 2021 December 31, 2020 Assets Current assets Cash and cash equivalents $ 33,857 $ 2,873 Accounts receivable, net 48,344 43,646 Inventories 63,978 60,923 Prepaid expenses 10,353 6,665 Other current assets 3,171 3,362 Assets held for sale 278 — Total current assets 159,981 117,469 Property and equipment, net 33,053 35,437 Deferred tax assets, net 7,059 12,900 Intangible assets, net 42,415 51,009 Goodwill 66,262 66,314 Other assets 3,026 150 Total assets $ 311,796 $ 283,279 Liabilities, Mezzanine Equity and Shareholders' Equity Current liabilities Accounts payable $ 19,328 $ 21,978 Accrued liabilities 40,736 36,004 Income tax payable 1,255 1,005 Liabilities held for sale 128 — Current portion of long - term debt 13,174 3,496 Total current liabilities 74,621 62,483 Long - term debt 146,516 209,310 Deferred tax liabilities 1,297 2,085 Other liabilities 722 550 Total liabilities 223,156 274,428 Mezzanine equity Preferred stock ($0.0001 par value, 10,000,000 shares authorized, no shares issued and outstanding as of December 31, 2021 and D ecember 31, 2020) — — Shareholders' equity Common stock ($0.0001 par value, 190,000,000 shares authorized, 34,383,350 shares and 27,483,350 shares issued and outstandin g a s of December 31, 2021 and December 31, 2020, respectively) 3 3 Additional paid - in capital 127,606 48,670 Accumulated other comprehensive loss (1,917) (2,860) Accumulated deficit (37,052) (36,962) Total shareholders’ equity 88,640 8,851 Total liabilities, mezzanine equity and shareholders' equity $ 311,796 $ 283,279 |