EX-99.2
Published on November 4, 2025
| THIRD QUARTER 2025 November 5, 2025 |

| 2 FORWARD-LOOKING STATEMENTS Please note that in this presentation we may use words such as “appears,” “anticipates,” “believes,” “plans,” “expects,” “intends,” “future,” and similar expressions which constitute forward-looking statements within the meaning of the safe harbor provisions of the Private Securities Litigation Reform Act of 1995. Forward-looking statements are made based on our expectations and beliefs concerning future events impacting the Company and therefore involve a number of risks and uncertainties. We caution that forward-looking statements are not guarantees and that actual results could differ materially from those expressed or implied in the forward-looking statements. Potential risks and uncertainties that could cause the actual results of operations or financial condition of the Company to differ materially from those expressed or implied by forward-looking statements in this presentation, include, but are not limited to those risks and uncertainties more fully described from time to time in the Company's public reports filed with the Securities and Exchange Commission, including under the section titled “Risk Factors” in the Company's Annual Report on Form 10-K, and/or Quarterly Reports on Form 10-Q, as well as in the Company’s Current Reports on Form 8-K. All forward-looking statements included in this presentation are based upon information available to the Company as of the date of this presentation and speak only as of the date hereof. We assume no obligation to update any forward-looking statements to reflect events or circumstances after the date of this presentation. 2 |
| TODAY’S PRESENTERS 3 WARREN KANDERS CEO and Chairman of the Board BRAD WILLIAMS President BLAINE BROWERS Chief Financial Officer |

| 4 AGENDA • Q3 Highlights • Business Overview • M&A Execution • Financial Summary • Full Year Outlook • Conclusion and Q&A |

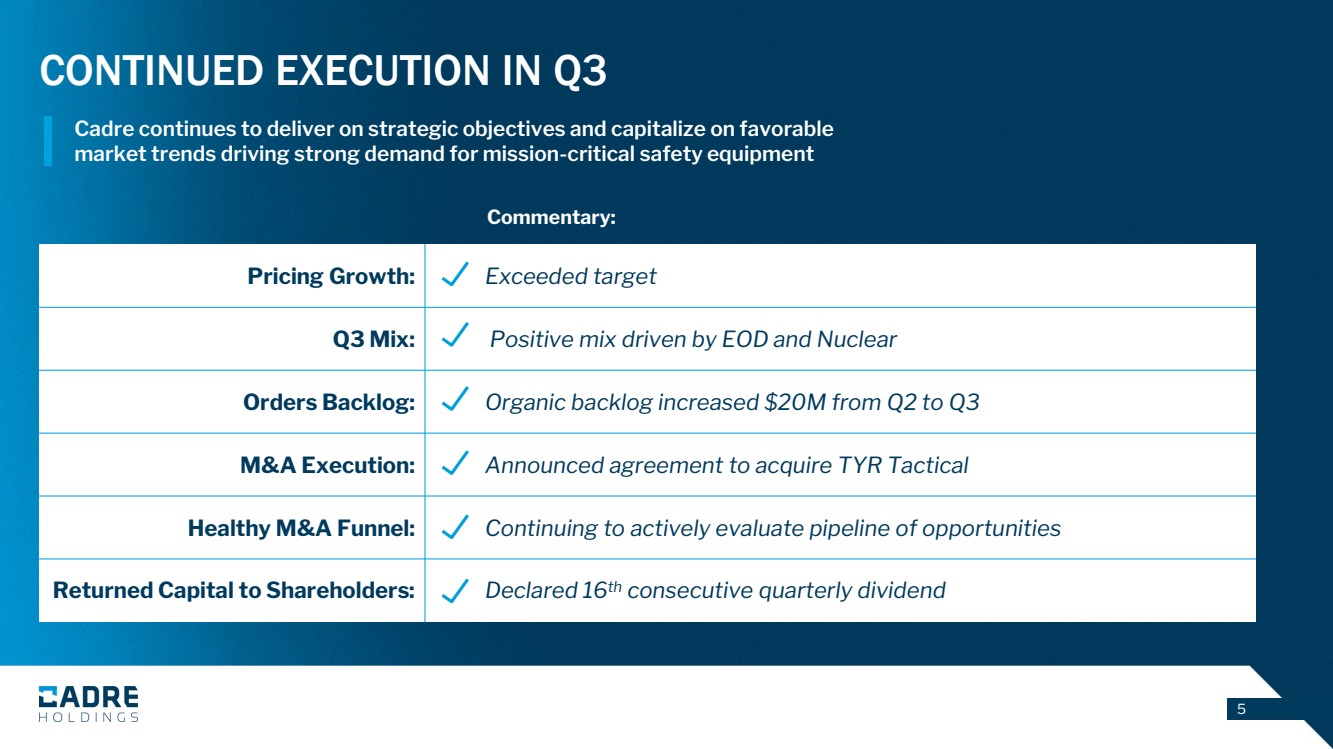
| 5 CONTINUED EXECUTION IN Q3 Pricing Growth: Exceeded target Q3 Mix: Positive mix driven by EOD and Nuclear Orders Backlog: Organic backlog increased $20M from Q2 to Q3 M&A Execution: Announced agreement to acquire TYR Tactical Healthy M&A Funnel: Continuing to actively evaluate pipeline of opportunities Returned Capital to Shareholders: Declared 16th consecutive quarterly dividend Commentary: Cadre continues to deliver on strategic objectives and capitalize on favorable market trends driving strong demand for mission-critical safety equipment |
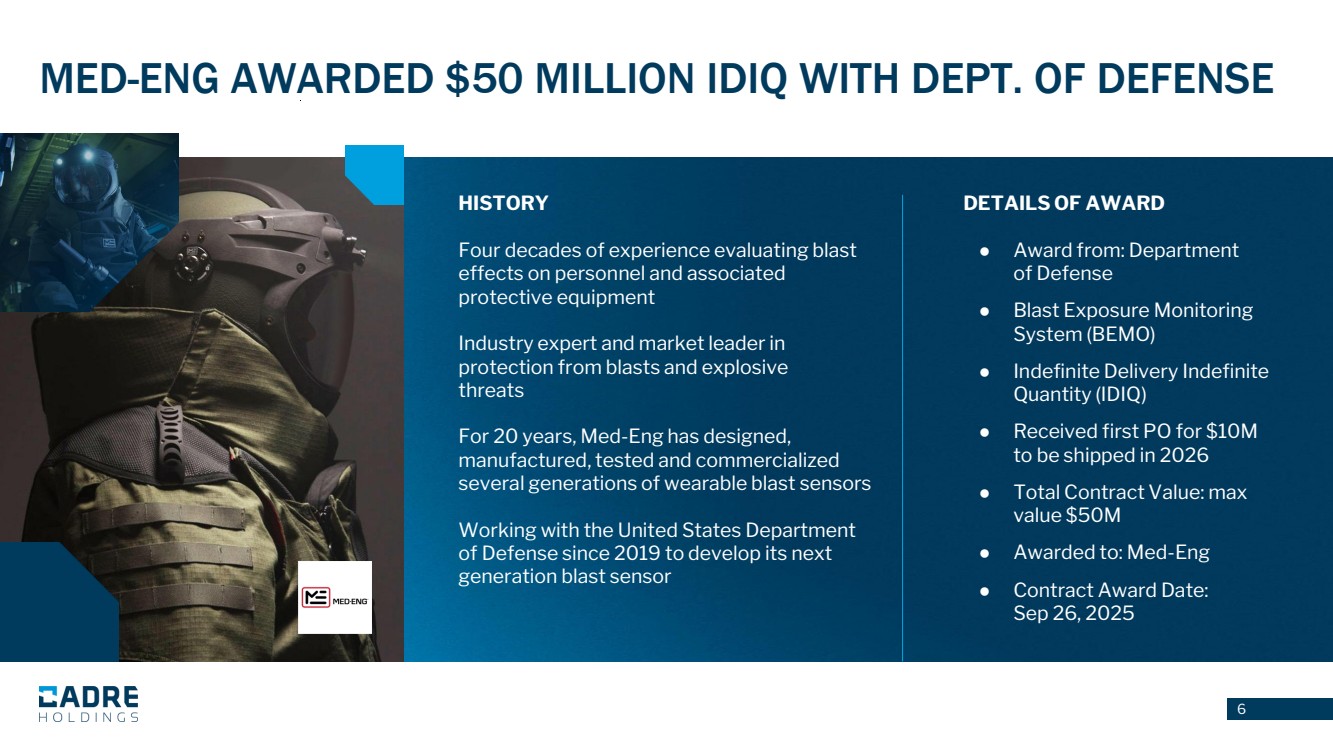
| 6 MED-ENG AWARDED $50 MILLION IDIQ WITH DEPT. OF DEFENSE HISTORY Four decades of experience evaluating blast effects on personnel and associated protective equipment Industry expert and market leader in protection from blasts and explosive threats For 20 years, Med-Eng has designed, manufactured, tested and commercialized several generations of wearable blast sensors Working with the United States Department of Defense since 2019 to develop its next generation blast sensor DETAILS OF AWARD ● Award from: Department of Defense ● Blast Exposure Monitoring System (BEMO) ● Indefinite Delivery Indefinite Quantity (IDIQ) ● Received first PO for $10M to be shipped in 2026 ● Total Contract Value: max value $50M ● Awarded to: Med-Eng ● Contract Award Date: Sep 26, 2025 |
| 7 LONG-TERM INDUSTRY TAILWINDS SUPPORTING SUSTAINABLE GROWTH OPPORTUNITY Commercial nuclear energy renaissance Ongoing and expanding national defense initiatives Environmental management to address nuclear clean up Catalysts drive steady, recurring demand Resilient and growing spend worldwide Rising safety threats globally Public Safety Tailwinds Nuclear Safety Tailwinds |

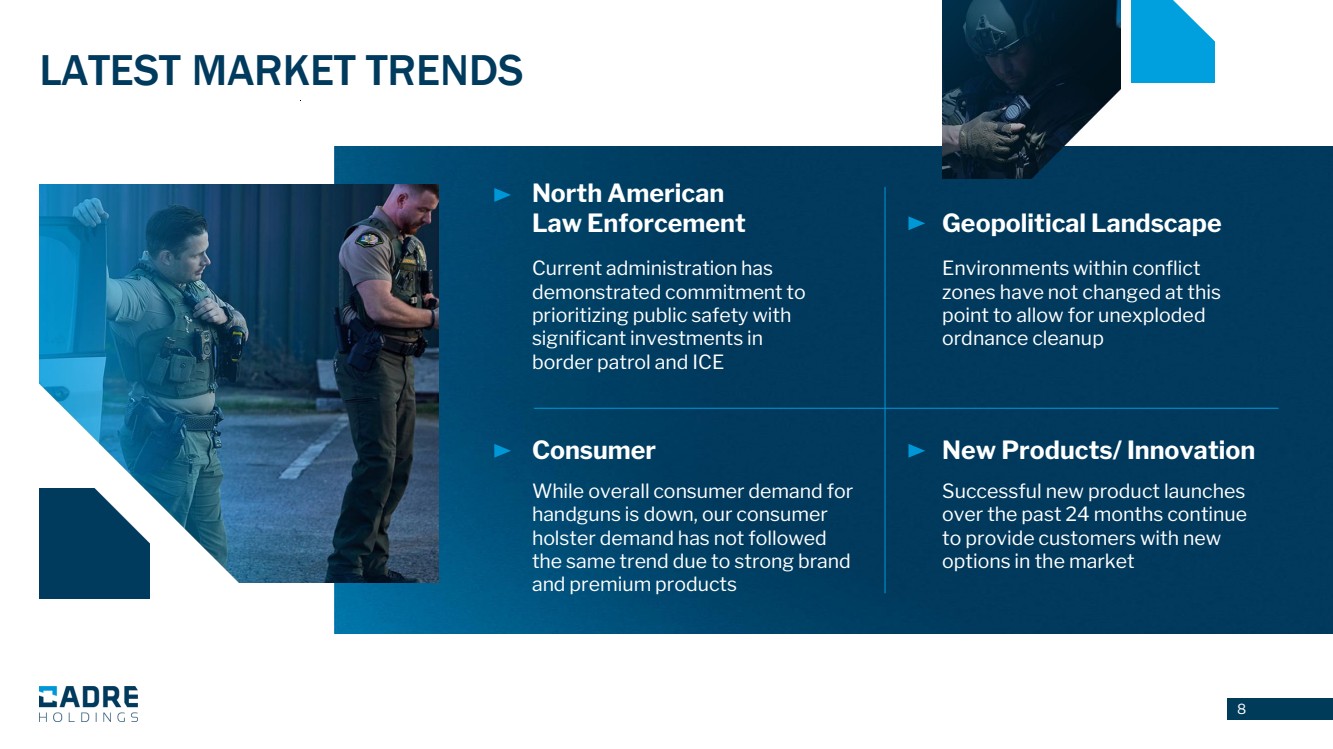
| 8 LATEST MARKET TRENDS Current administration has demonstrated commitment to prioritizing public safety with significant investments in border patrol and ICE Environments within conflict zones have not changed at this point to allow for unexploded ordnance cleanup While overall consumer demand for handguns is down, our consumer holster demand has not followed the same trend due to strong brand and premium products Successful new product launches over the past 24 months continue to provide customers with new options in the market North American Law Enforcement Geopolitical Landscape Consumer New Products/ Innovation |
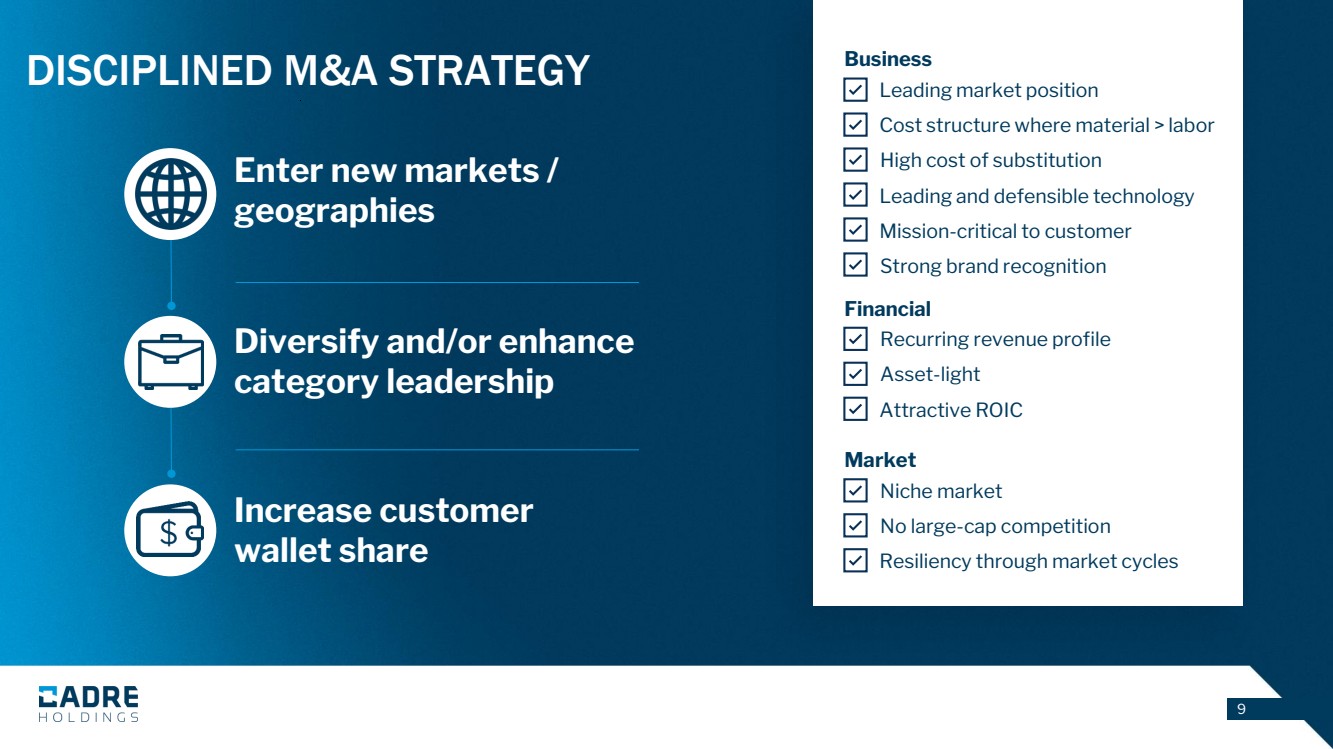
| 9 DISCIPLINED M&A STRATEGY Business Financial Market Leading market position Cost structure where material > labor High cost of substitution Leading and defensible technology Mission-critical to customer Strong brand recognition Recurring revenue profile Asset-light Attractive ROIC Niche market No large-cap competition Resiliency through market cycles Enter new markets / geographies Diversify and/or enhance category leadership Increase customer wallet share |
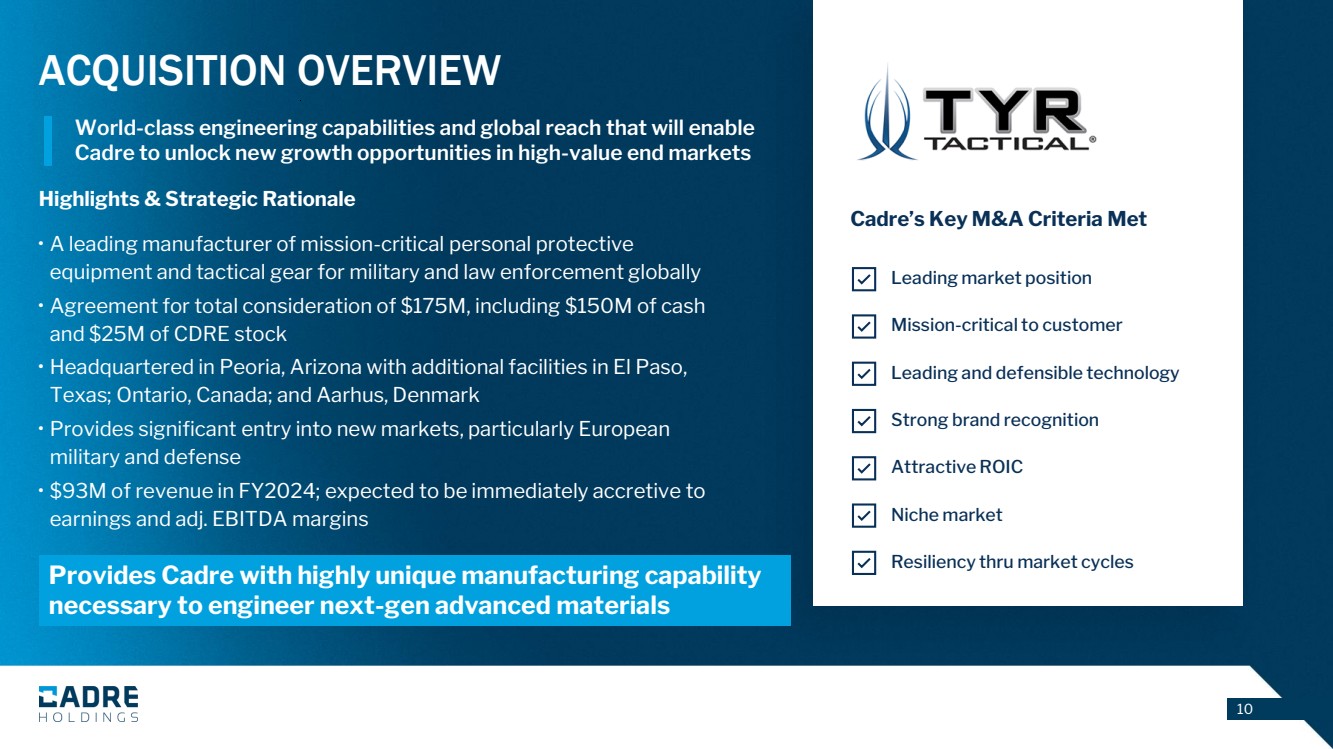
| 10 ACQUISITION OVERVIEW World-class engineering capabilities and global reach that will enable Cadre to unlock new growth opportunities in high-value end markets Highlights & Strategic Rationale • A leading manufacturer of mission-critical personal protective equipment and tactical gear for military and law enforcement globally • Agreement for total consideration of $175M, including $150M of cash and $25M of CDRE stock • Headquartered in Peoria, Arizona with additional facilities in El Paso, Texas; Ontario, Canada; and Aarhus, Denmark • Provides significant entry into new markets, particularly European military and defense • $93M of revenue in FY2024; expected to be immediately accretive to earnings and adj. EBITDA margins Leading market position Mission-critical to customer Leading and defensible technology Strong brand recognition Attractive ROIC Niche market Resiliency thru market cycles Cadre’s Key M&A Criteria Met Provides Cadre with highly unique manufacturing capability necessary to engineer next-gen advanced materials |
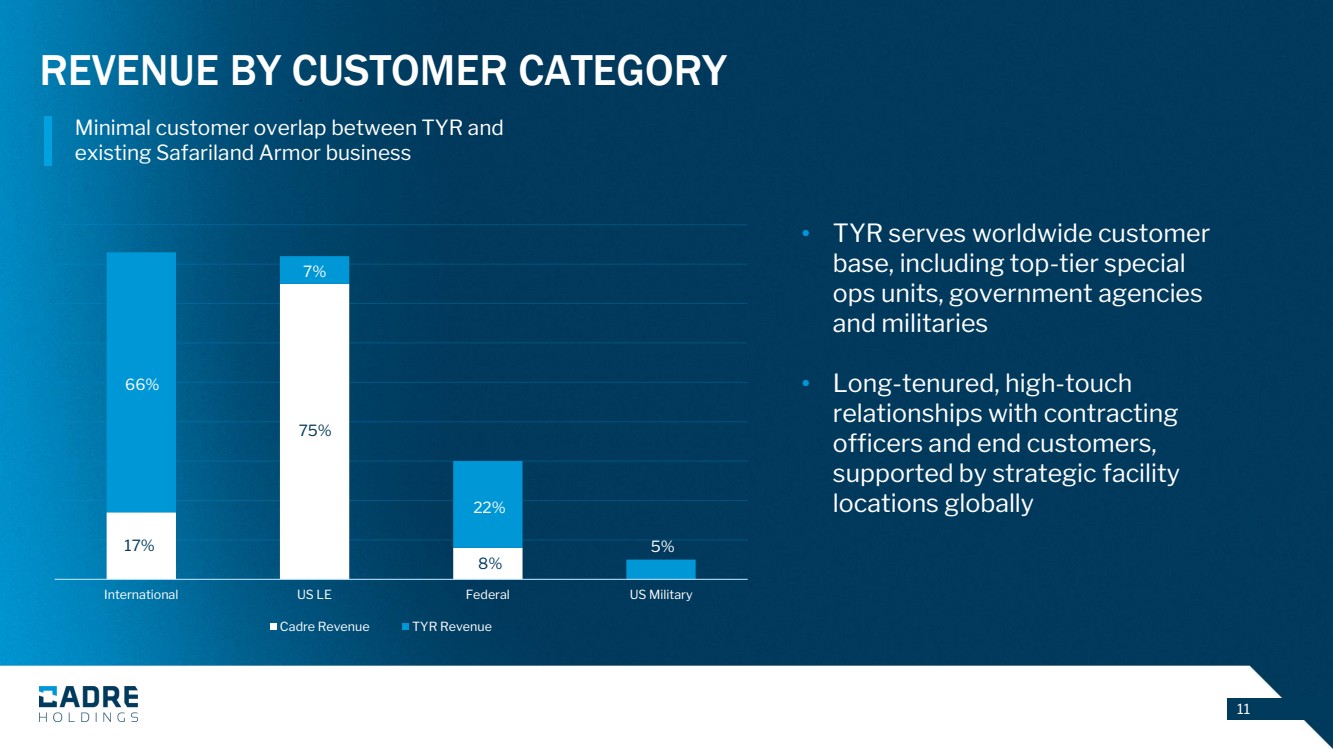
| 11 REVENUE BY CUSTOMER CATEGORY • TYR serves worldwide customer base, including top-tier special ops units, government agencies and militaries • Long-tenured, high-touch relationships with contracting officers and end customers, supported by strategic facility locations globally International US LE Federal US Military Cadre Revenue TYR Revenue 17% 66% 75% 7% 8% 22% 5% Minimal customer overlap between TYR and existing Safariland Armor business |
| 12 Q3 FINANCIAL RESULTS |

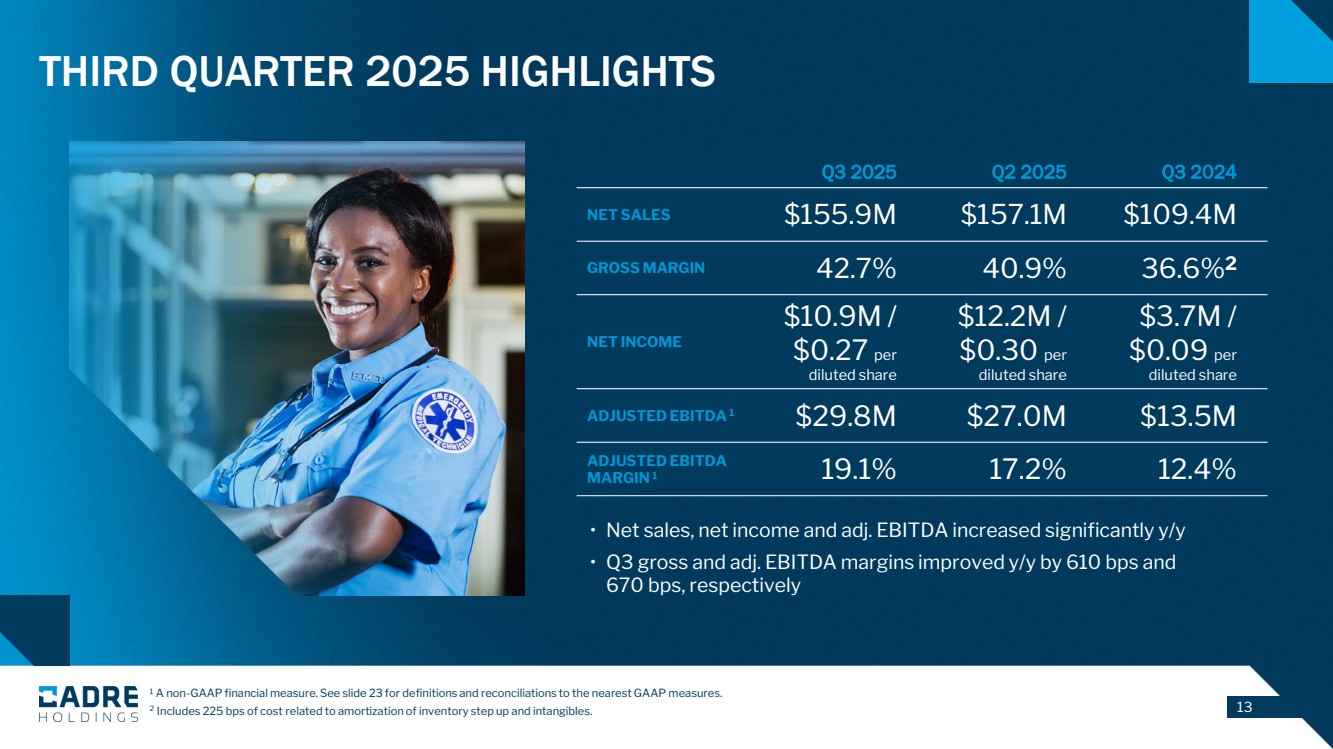
| 13 • Net sales, net income and adj. EBITDA increased significantly y/y • Q3 gross and adj. EBITDA margins improved y/y by 610 bps and 670 bps, respectively THIRD QUARTER 2025 HIGHLIGHTS Q3 2025 Q2 2025 Q3 2024 NET SALES $155.9M $157.1M $109.4M GROSS MARGIN 42.7% 40.9% 36.6%2 NET INCOME $10.9M / $0.27 per diluted share $12.2M / $0.30 per diluted share $3.7M / $0.09 per diluted share ADJUSTED EBITDA 1 $29.8M $27.0M $13.5M ADJUSTED EBITDA MARGIN 1 19.1% 17.2% 12.4% 1 A non-GAAP financial measure. See slide 23 for definitions and reconciliations to the nearest GAAP measures. 2 Includes 225 bps of cost related to amortization of inventory step up and intangibles. |
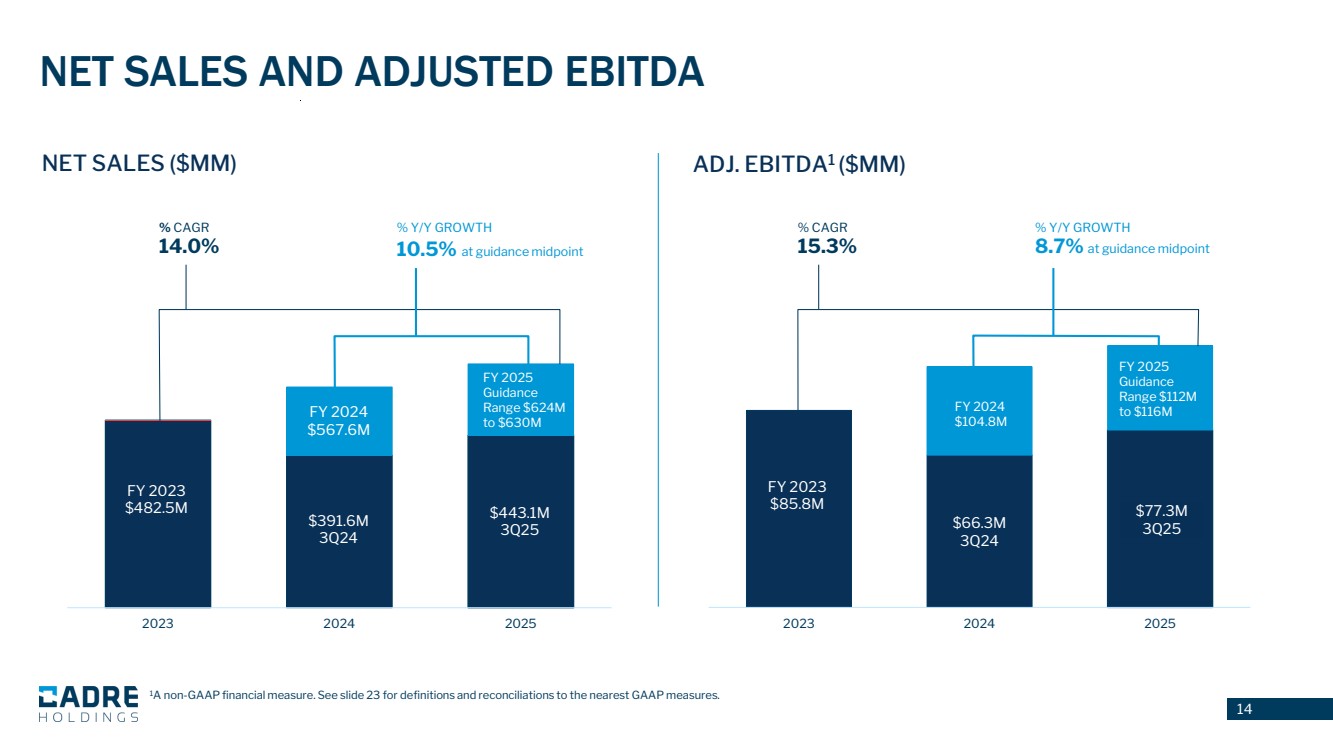
| 14 $66.3M 3Q24 2023 2024 2025 $391.6M 3Q24 FY 2023 $482.5M 2023 2024 2025 FY 2024 $567.6M NET SALES AND ADJUSTED EBITDA NET SALES ($MM) ADJ. EBITDA1 ($MM) FY 2025 Guidance Range $624M to $630M FY 2025 Guidance Range $112M to $116M % CAGR 14.0% % Y/Y GROWTH 10.5% at guidance midpoint % CAGR 15.3% % Y/Y GROWTH 8.7% at guidance midpoint $443.1M 3Q25 $77.3M 3Q25 FY 2023 $85.8M FY 2024 $104.8M 1A non-GAAP financial measure. See slide 23 for definitions and reconciliations to the nearest GAAP measures. |
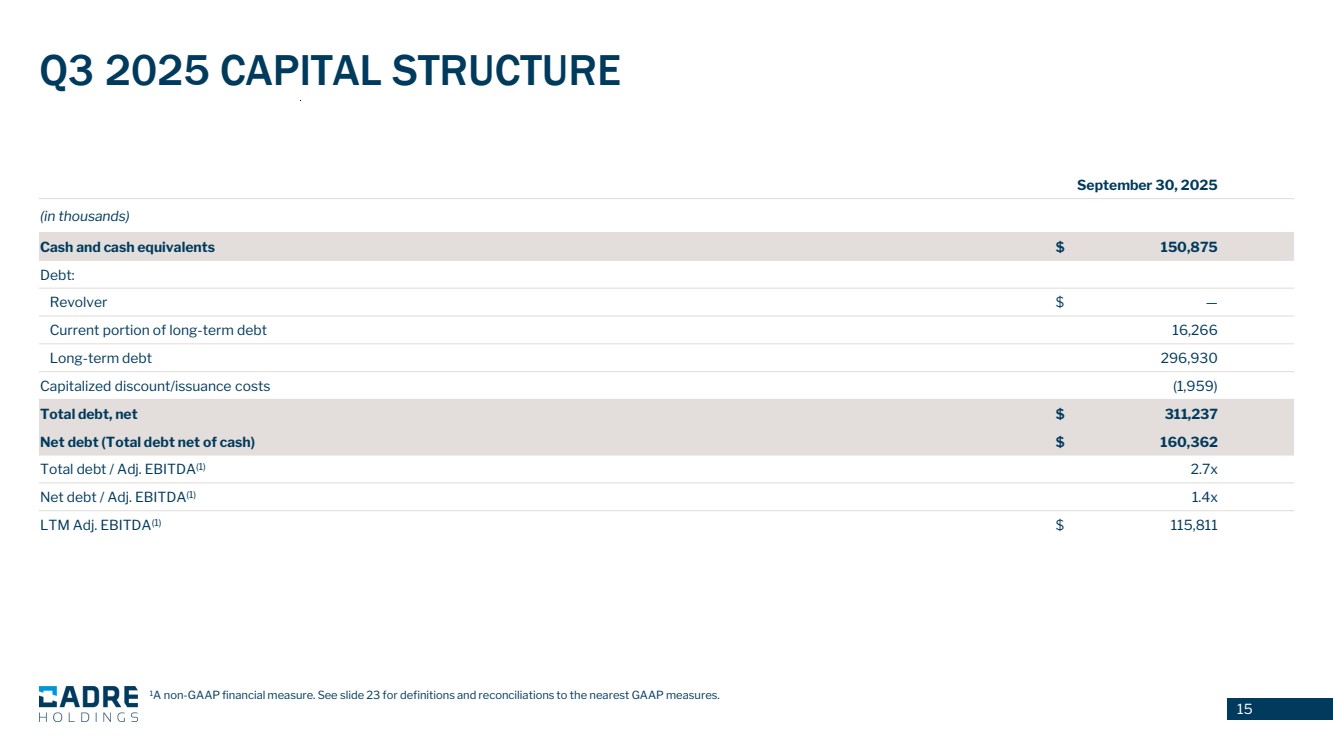
| 15 Q3 2025 CAPITAL STRUCTURE September 30, 2025 (in thousands) Cash and cash equivalents $ 150,875 Debt: Revolver $ — Current portion of long-term debt 16,266 Long-term debt 296,930 Capitalized discount/issuance costs (1,959) Total debt, net $ 311,237 Net debt (Total debt net of cash) $ 160,362 Total debt / Adj. EBITDA(1) 2.7x Net debt / Adj. EBITDA(1) 1.4x LTM Adj. EBITDA(1) $ 115,811 1A non-GAAP financial measure. See slide 23 for definitions and reconciliations to the nearest GAAP measures. |
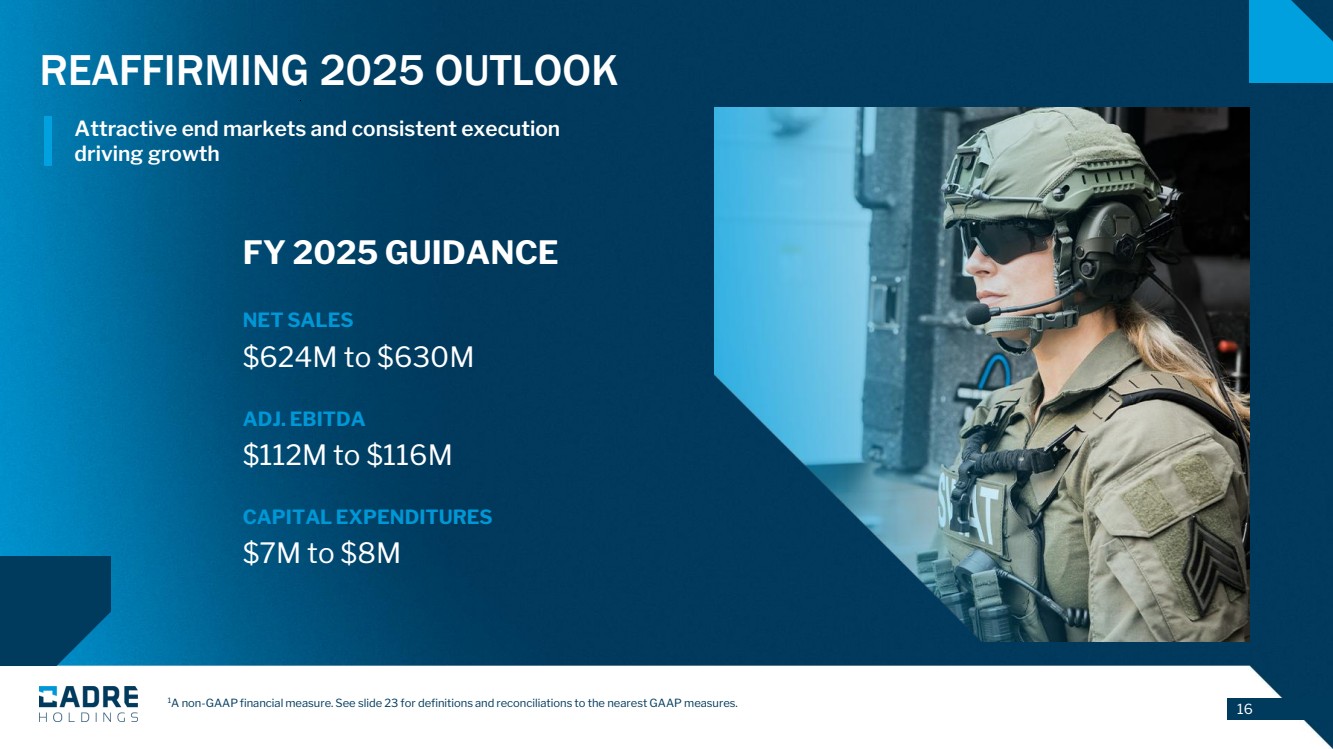
| 16 1A non-GAAP financial measure. See slide 23 for definitions and reconciliations to the nearest GAAP measures. FY 2025 GUIDANCE NET SALES $624M to $630M ADJ. EBITDA $112M to $116M CAPITAL EXPENDITURES $7M to $8M REAFFIRMING 2025 OUTLOOK Attractive end markets and consistent execution driving growth |
| 17 CONCLUSION Execution in line with strategic objectives in Q3 Ongoing implementation of Cadre operating model Committed to improving gross and Adj. EBITDA margins Capitalizing on strong macro tailwinds driving demand and visibility for Cadre's mission-critical products Executing on M&A pipeline, building capabilities and gaining exposure to new markets |
| 18 APPENDIX |
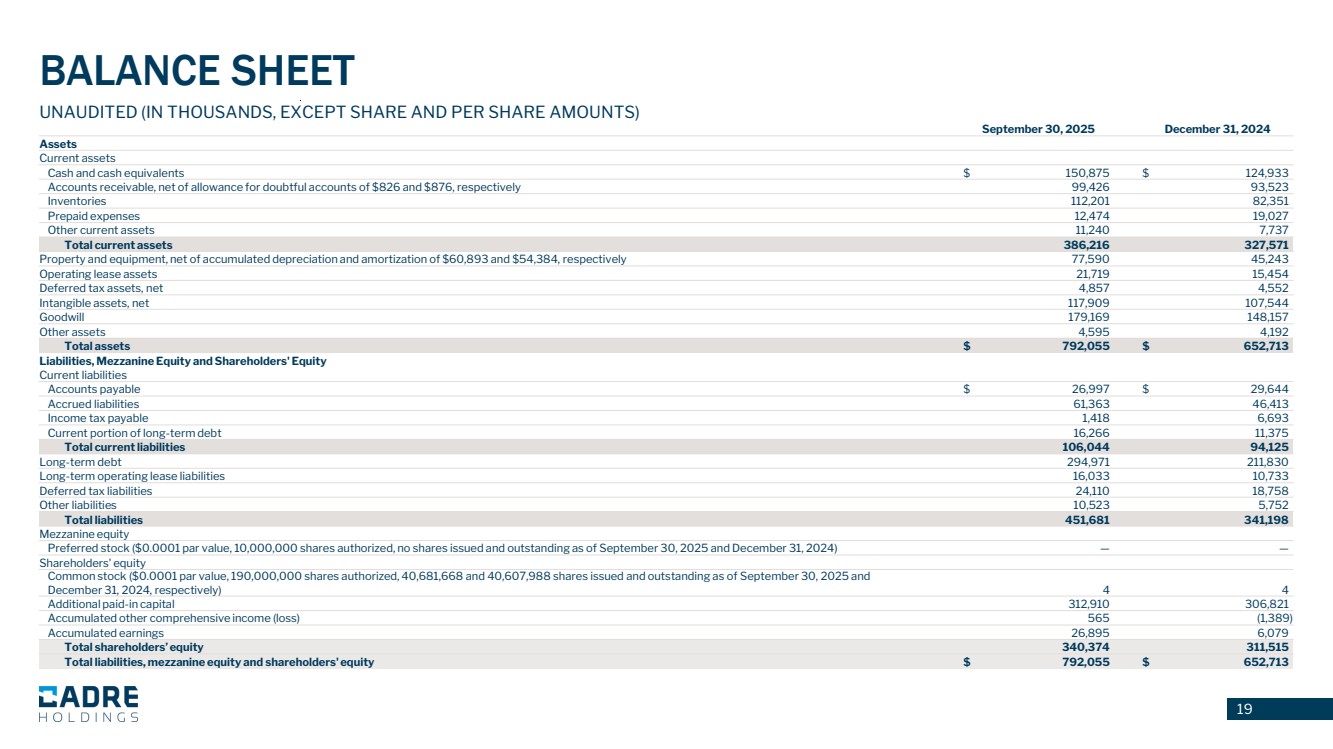
| 19 BALANCE SHEET UNAUDITED (IN THOUSANDS, EXCEPT SHARE AND PER SHARE AMOUNTS) September 30, 2025 December 31, 2024 Assets Current assets Cash and cash equivalents $ 150,875 $ 124,933 Accounts receivable, net of allowance for doubtful accounts of $826 and $876, respectively 99,426 93,523 Inventories 112,201 82,351 Prepaid expenses 12,474 19,027 Other current assets 11,240 7,737 Total current assets 386,216 327,571 Property and equipment, net of accumulated depreciation and amortization of $60,893 and $54,384, respectively 77,590 45,243 Operating lease assets 21,719 15,454 Deferred tax assets, net 4,857 4,552 Intangible assets, net 117,909 107,544 Goodwill 179,169 148,157 Other assets 4,595 4,192 Total assets $ 792,055 $ 652,713 Liabilities, Mezzanine Equity and Shareholders' Equity Current liabilities Accounts payable $ 26,997 $ 29,644 Accrued liabilities 61,363 46,413 Income tax payable 1,418 6,693 Current portion of long-term debt 16,266 11,375 Total current liabilities 106,044 94,125 Long-term debt 294,971 211,830 Long-term operating lease liabilities 16,033 10,733 Deferred tax liabilities 24,110 18,758 Other liabilities 10,523 5,752 Total liabilities 451,681 341,198 Mezzanine equity Preferred stock ($0.0001 par value, 10,000,000 shares authorized, no shares issued and outstanding as of September 30, 2025 and December 31, 2024) — — Shareholders' equity Common stock ($0.0001 par value, 190,000,000 shares authorized, 40,681,668 and 40,607,988 shares issued and outstanding as of September 30, 2025 and December 31, 2024, respectively) 4 4 Additional paid-in capital 312,910 306,821 Accumulated other comprehensive income (loss) 565 (1,389) Accumulated earnings 26,895 6,079 Total shareholders’ equity 340,374 311,515 Total liabilities, mezzanine equity and shareholders' equity $ 792,055 $ 652,713 |
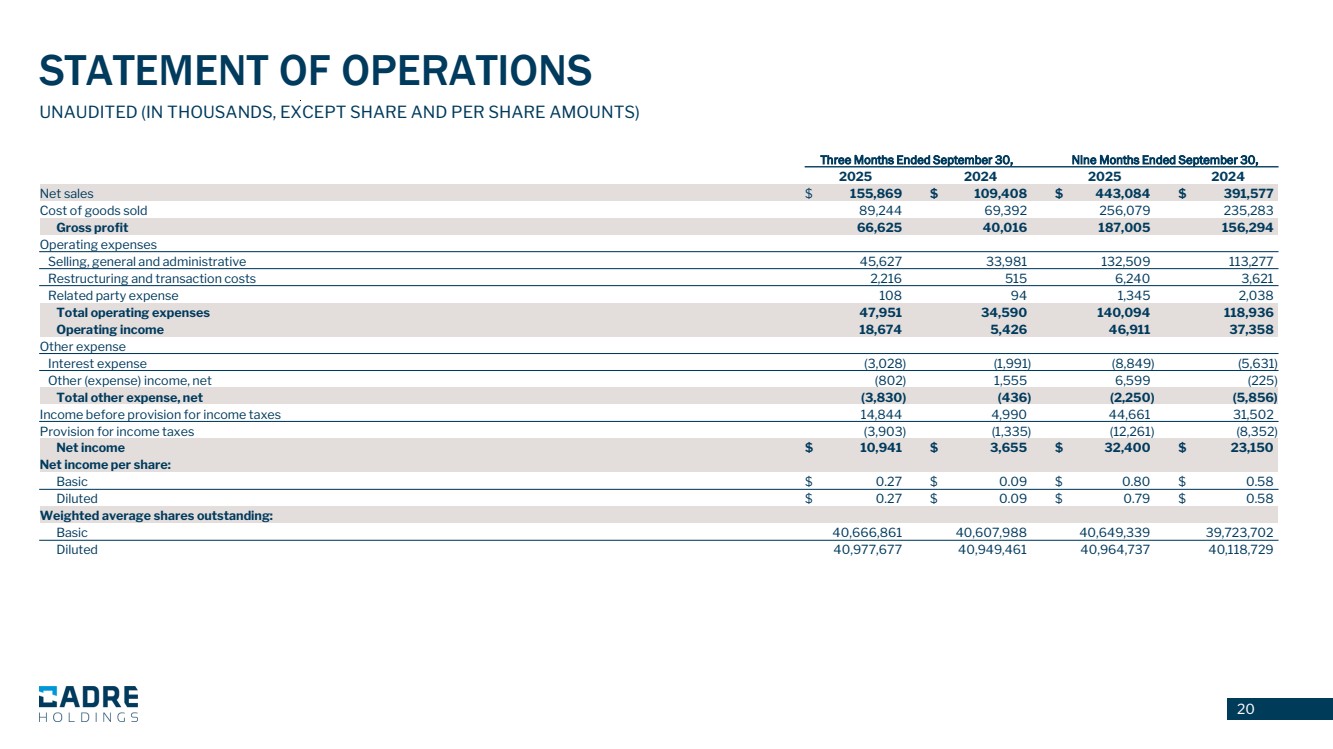
| 20 UNAUDITED (IN THOUSANDS, EXCEPT SHARE AND PER SHARE AMOUNTS) Three Months Ended September 30, Nine Months Ended September 30, 2025 2024 2025 2024 Net sales $ 155,869 $ 109,408 $ 443,084 $ 391,577 Cost of goods sold 89,244 69,392 256,079 235,283 Gross profit 66,625 40,016 187,005 156,294 Operating expenses Selling, general and administrative 45,627 33,981 132,509 113,277 Restructuring and transaction costs 2,216 515 6,240 3,621 Related party expense 108 94 1,345 2,038 Total operating expenses 47,951 34,590 140,094 118,936 Operating income 18,674 5,426 46,911 37,358 Other expense Interest expense (3,028) (1,991) (8,849) (5,631) Other (expense) income, net (802) 1,555 6,599 (225) Total other expense, net (3,830) (436) (2,250) (5,856) Income before provision for income taxes 14,844 4,990 44,661 31,502 Provision for income taxes (3,903) (1,335) (12,261) (8,352) Net income $ 10,941 $ 3,655 $ 32,400 $ 23,150 Net income per share: Basic $ 0.27 $ 0.09 $ 0.80 $ 0.58 Diluted $ 0.27 $ 0.09 $ 0.79 $ 0.58 Weighted average shares outstanding: Basic 40,666,861 40,607,988 40,649,339 39,723,702 Diluted 40,977,677 40,949,461 40,964,737 40,118,729 STATEMENT OF OPERATIONS |
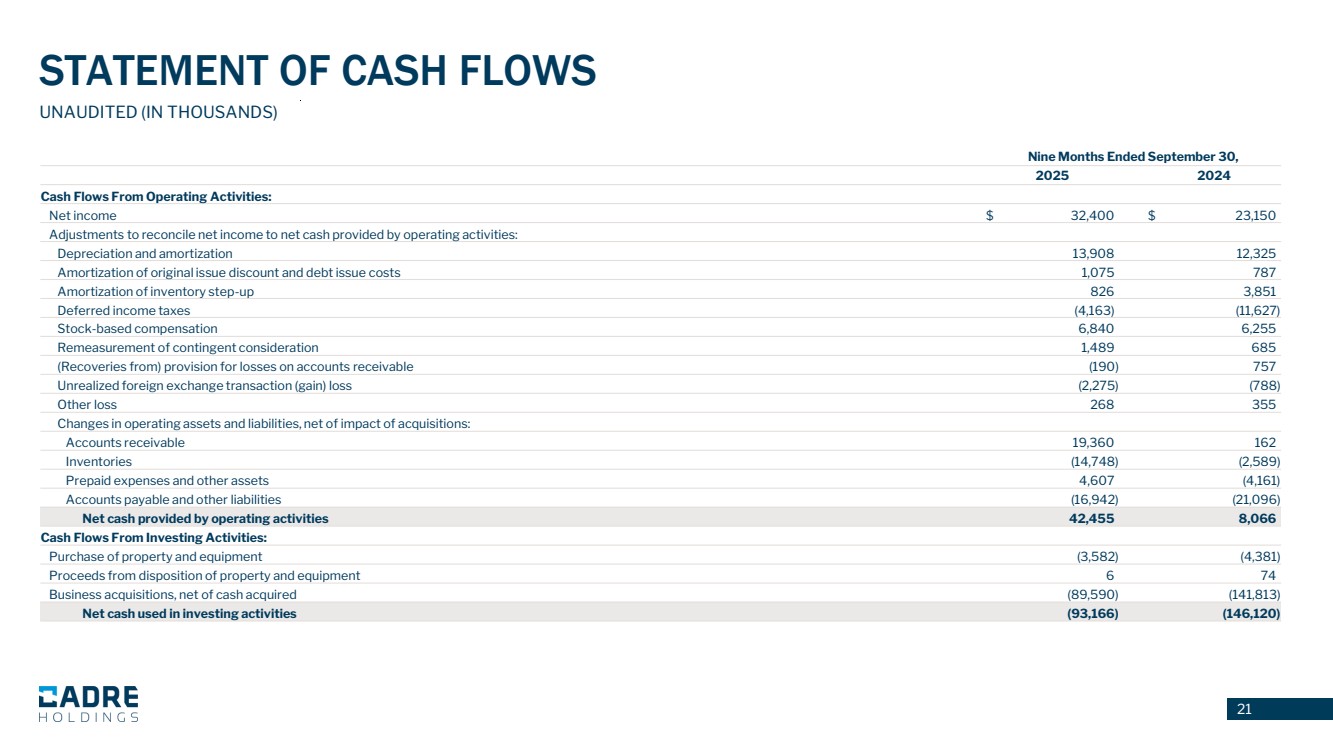
| 21 UNAUDITED (IN THOUSANDS) Nine Months Ended September 30, 2025 2024 Cash Flows From Operating Activities: Net income $ 32,400 $ 23,150 Adjustments to reconcile net income to net cash provided by operating activities: Depreciation and amortization 13,908 12,325 Amortization of original issue discount and debt issue costs 1,075 787 Amortization of inventory step-up 826 3,851 Deferred income taxes (4,163) (11,627) Stock-based compensation 6,840 6,255 Remeasurement of contingent consideration 1,489 685 (Recoveries from) provision for losses on accounts receivable (190) 757 Unrealized foreign exchange transaction (gain) loss (2,275) (788) Other loss 268 355 Changes in operating assets and liabilities, net of impact of acquisitions: Accounts receivable 19,360 162 Inventories (14,748) (2,589) Prepaid expenses and other assets 4,607 (4,161) Accounts payable and other liabilities (16,942) (21,096) Net cash provided by operating activities 42,455 8,066 Cash Flows From Investing Activities: Purchase of property and equipment (3,582) (4,381) Proceeds from disposition of property and equipment 6 74 Business acquisitions, net of cash acquired (89,590) (141,813) Net cash used in investing activities (93,166) (146,120) STATEMENT OF CASH FLOWS |
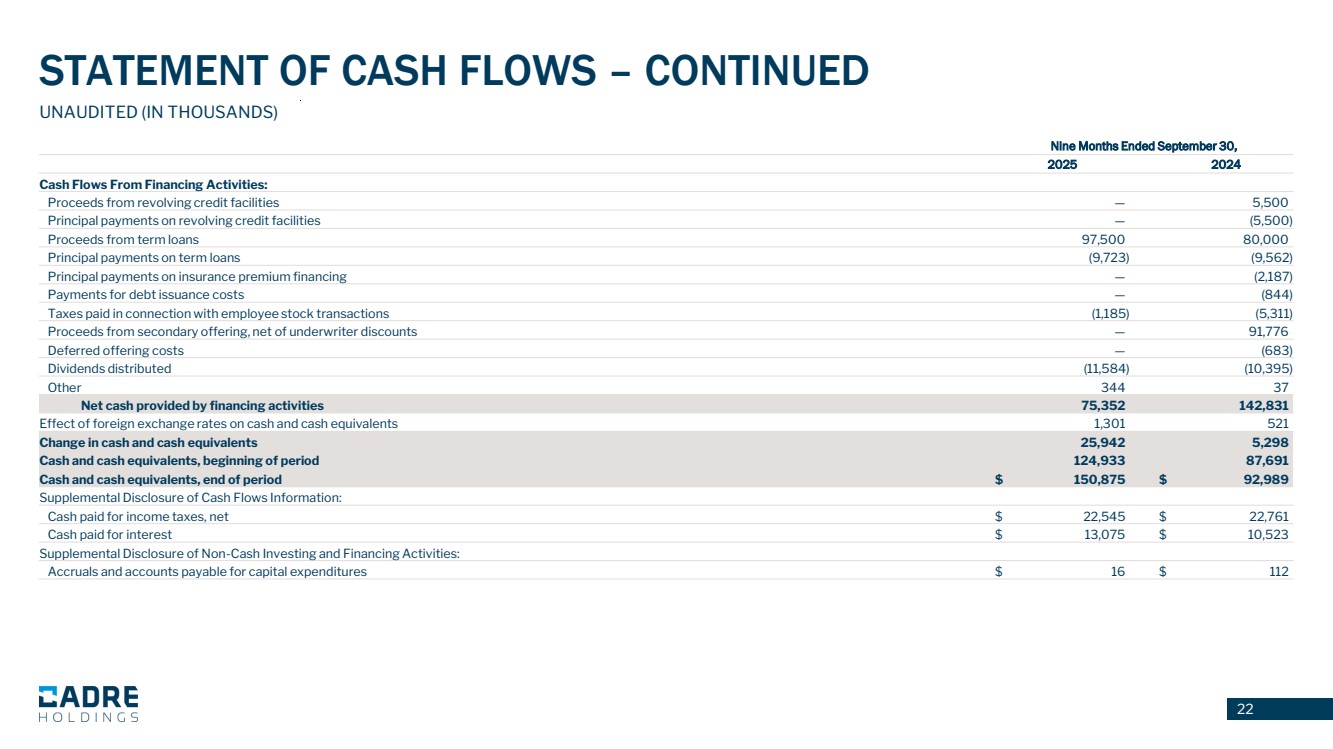
| 22 UNAUDITED (IN THOUSANDS) Nine Months Ended September 30, 2025 2024 Cash Flows From Financing Activities: Proceeds from revolving credit facilities — 5,500 Principal payments on revolving credit facilities — (5,500) Proceeds from term loans 97,500 80,000 Principal payments on term loans (9,723) (9,562) Principal payments on insurance premium financing — (2,187) Payments for debt issuance costs — (844) Taxes paid in connection with employee stock transactions (1,185) (5,311) Proceeds from secondary offering, net of underwriter discounts — 91,776 Deferred offering costs — (683) Dividends distributed (11,584) (10,395) Other 344 37 Net cash provided by financing activities 75,352 142,831 Effect of foreign exchange rates on cash and cash equivalents 1,301 521 Change in cash and cash equivalents 25,942 5,298 Cash and cash equivalents, beginning of period 124,933 87,691 Cash and cash equivalents, end of period $ 150,875 $ 92,989 Supplemental Disclosure of Cash Flows Information: Cash paid for income taxes, net $ 22,545 $ 22,761 Cash paid for interest $ 13,075 $ 10,523 Supplemental Disclosure of Non-Cash Investing and Financing Activities: Accruals and accounts payable for capital expenditures $ 16 $ 112 STATEMENT OF CASH FLOWS – CONTINUED |
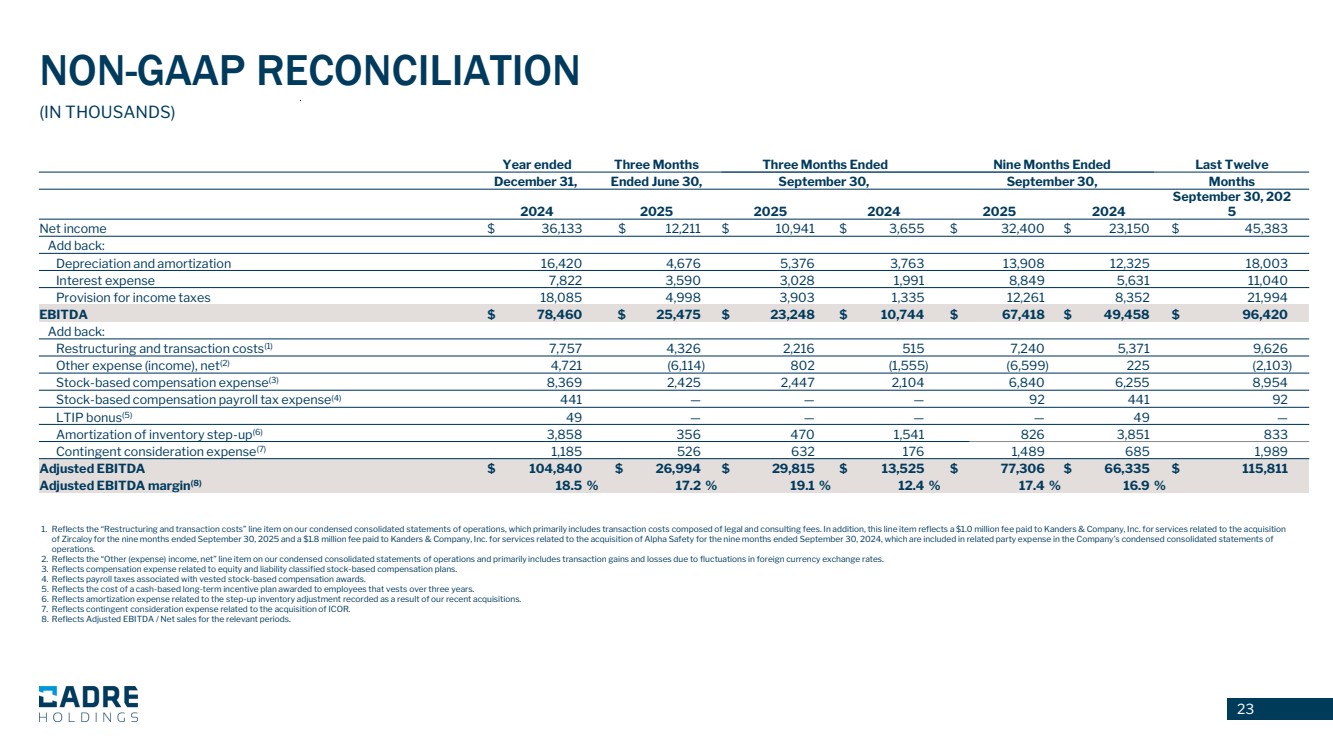
| 23 1. Reflects the “Restructuring and transaction costs” line item on our condensed consolidated statements of operations, which primarily includes transaction costs composed of legal and consulting fees. In addition, this line item reflects a $1.0 million fee paid to Kanders & Company, Inc. for services related to the acquisition of Zircaloy for the nine months ended September 30, 2025 and a $1.8 million fee paid to Kanders & Company, Inc. for services related to the acquisition of Alpha Safety for the nine months ended September 30, 2024, which are included in related party expense in the Company’s condensed consolidated statements of operations. 2. Reflects the “Other (expense) income, net” line item on our condensed consolidated statements of operations and primarily includes transaction gains and losses due to fluctuations in foreign currency exchange rates. 3. Reflects compensation expense related to equity and liability classified stock-based compensation plans. 4. Reflects payroll taxes associated with vested stock-based compensation awards. 5. Reflects the cost of a cash-based long-term incentive plan awarded to employees that vests over three years. 6. Reflects amortization expense related to the step-up inventory adjustment recorded as a result of our recent acquisitions. 7. Reflects contingent consideration expense related to the acquisition of ICOR. 8. Reflects Adjusted EBITDA / Net sales for the relevant periods. 23 (IN THOUSANDS) NON-GAAP RECONCILIATION Year ended Three Months Three Months Ended Nine Months Ended Last Twelve December 31, Ended June 30, September 30, September 30, Months 2024 2025 2025 2024 2025 2024 September 30, 202 5 Net income $ 36,133 $ 12,211 $ 10,941 $ 3,655 $ 32,400 $ 23,150 $ 45,383 Add back: Depreciation and amortization 16,420 4,676 5,376 3,763 13,908 12,325 18,003 Interest expense 7,822 3,590 3,028 1,991 8,849 5,631 11,040 Provision for income taxes 18,085 4,998 3,903 1,335 12,261 8,352 21,994 EBITDA $ 78,460 $ 25,475 $ 23,248 $ 10,744 $ 67,418 $ 49,458 $ 96,420 Add back: Restructuring and transaction costs(1) 7,757 4,326 2,216 515 7,240 5,371 9,626 Other expense (income), net(2) 4,721 (6,114) 802 (1,555) (6,599) 225 (2,103) Stock-based compensation expense(3) 8,369 2,425 2,447 2,104 6,840 6,255 8,954 Stock-based compensation payroll tax expense(4) 441 — — — 92 441 92 LTIP bonus(5) 49 — — — — 49 — Amortization of inventory step-up(6) 3,858 356 470 1,541 826 3,851 833 Contingent consideration expense(7) 1,185 526 632 176 1,489 685 1,989 Adjusted EBITDA $ 104,840 $ 26,994 $ 29,815 $ 13,525 $ 77,306 $ 66,335 $ 115,811 Adjusted EBITDA margin(8) 18.5 % 17.2 % 19.1 % 12.4 % 17.4 % 16.9 % |
| 24 The Company reports its financial results in accordance with U.S. generally accepted accounting principles (“GAAP”). The presentation contains the non-GAAP measures: (i) earnings before interest, taxes, other income or expense, depreciation and amortization (“EBITDA”), (ii) adjusted EBITDA and (iii) adjusted EBITDA margin and (iv) last twelve months adjusted EBITDA. The Company believes the presentation of these non-GAAP measures provides useful information for the understanding of its ongoing operations and enables investors to focus on period-over-period operating performance, and thereby enhances the user’s overall understanding of the Company’s current financial performance relative to past performance and provides, along with the nearest GAAP measures, a baseline for modeling future earnings expectations. Non-GAAP measures are reconciled to comparable GAAP financial measures within this presentation. We do not provide a reconciliation of the non-GAAP guidance measure Adjusted EBITDA for the fiscal year 2025 to net income for the fiscal year 2025, the most comparable GAAP financial measure, due to the inherent difficulty of forecasting certain types of expenses and gains, without unreasonable effort, which affect net income but not Adjusted EBITDA. The Company cautions that non-GAAP measures should be considered in addition to, but not as a substitute for, the Company’s reported GAAP results. Additionally, the Company notes that there can be no assurance that the above referenced non-GAAP financial measures are comparable to similarly titled financial measures used by other publicly traded companies. USE OF NON-GAAP MEASURES |